
Eight new stocks make our Safest Dividend Yields Model Portfolio this month, which was made available to members on July 22, 2020.
Recap from June’s Picks
On a price return basis, our Safest Dividend Yields Model Portfolio (-0.6%) underperformed the S&P 500 (+3.9%) by 4.5% from June 23, 2020 through July 20, 2020. On a total return basis, the Model Portfolio (-0.4%) underperformed the S&P 500 (+3.9%) by 4.3% over the same time. The best performing large cap stock was up 24%, and the best performing small cap stock was up 12%. Overall, four out of the 20 Safest Dividend Yield stocks outperformed their respective benchmarks (S&P 500 and Russell 2000) from June 23, 2020 through July 20, 2020.
Only our research utilizes the superior data and earnings adjustments featured by the HBS & MIT Sloan paper, "Core Earnings: New Data and Evidence.” This Model Portfolio leverages our Robo-Analyst technology[1], which scales our forensic accounting expertise (featured in Barron’s) across thousands of stocks.[2]
This Model Portfolio only includes stocks that earn an Attractive or Very Attractive rating, have positive free cash flow and economic earnings, and offer a dividend yield greater than 3%. Companies with strong free cash flow provide higher quality and safer dividend yields because we know they have the cash to support the dividend. We think this portfolio provides a uniquely well-screened group of stocks that can help clients outperform.
Featured Stock for July: MSC Industrial Direct Co, Inc. (MSM: $68/share)
MSC Industrial Direct Co, Inc. (MSM), is the featured stock in July’s Safest Dividend Yields Model Portfolio.
MSC Industrial Direct has grown revenue by 8% compounded annually and net operating profit after-tax (NOPAT) by 9% compounded annually over the past decade. Longer term, MSC Industrial Direct grew NOPAT by 13% compounded annually over the past two decades. The firm’s NOPAT margin increased from 4% in 1999 to 8% over the TTM, while its return on invested capital (ROIC) improved from 6% to 13% over the same time.
Figure 1: MSC Industrial Direct’s Revenue & NOPAT Since 2009
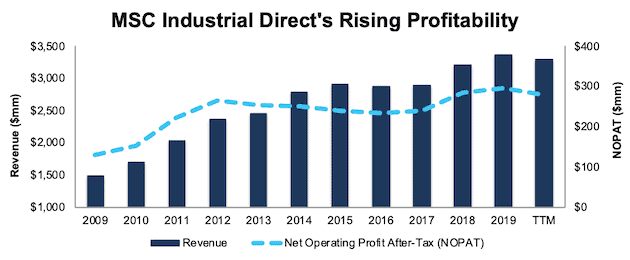
Sources: New Constructs, LLC and company filings
Cash Flow Supports Dividend Payments
MSC Industrial Direct has paid a dividend in each of the past seventeen years. The firm increased its dividend payments from $1.72/share in 2016 to $2.64/share in 2019, or 15% compounded annually. The current quarterly dividend, when annualized provides a 4.4% dividend yield.
MSC Industrial Direct’s dividend payment is supported by the firm’s strong free cash flow (FCF). MSC Industrial Direct generated $860 million (23% of current market cap) in FCF while paying $479 million in dividends from 2016 to 2019, per Figure 2.
Figure 2: MSC Industrial Direct’s FCF vs. Dividends Since 2016
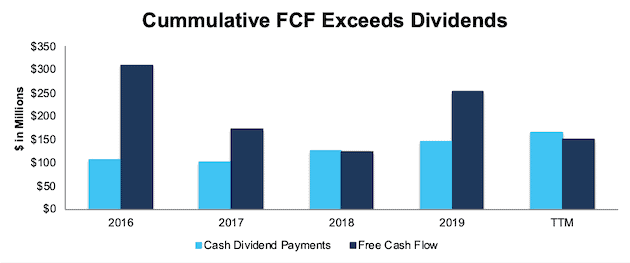
Sources: New Constructs, LLC and company filings
Companies with strong FCF provide higher quality dividend yields because we know the firm has the cash to support its dividend. On the other hand, dividends from companies with low or negative FCF cannot be trusted as much because the company may not be able to sustain paying dividends.
MSM Is Undervalued
At its current price of $68/share, MSM has a price-to-economic book value (PEBV) ratio of 0.7. This ratio means the market expects MSC Industrial Direct’s NOPAT to permanently decline by 30%. This expectation seems overly pessimistic given that MSC Industrial Direct has grown NOPAT by 9% compounded annually over the past decade.
Even if MSC Industrial Direct’s NOPAT margin falls to 7% (below 10-year average of 9%), and the firm grows revenue by just 2% compounded annually, which results in NOPAT falling by less than 1% compounded annually over the next decade, the stock is worth $88/share today – a 29% upside. See the math behind this reverse DCF scenario.
Critical Details Found in Financial Filings by Our Robo-Analyst Technology
As investors focus more on fundamental research, research automation technology is needed to analyze all the critical financial details in financial filings as shown in the Harvard Business School and MIT Sloan paper,"Core Earnings: New Data and Evidence”.
Below are specifics on the adjustments we make based on Robo-Analyst findings in MSC Industrial Direct’s 2019 10-K:
Income Statement: we made $50 million of adjustments with a net effect of removing $6 million in non-operating expenses (<1% of revenue). See all adjustments made to MSC Industrial Direct’s income statement here.
Balance Sheet: we made $295 million of adjustments to calculate invested capital with a net increase of $257 million. The most notable adjustment was $58 million (3% of reported net assets) in operating leases. See all adjustments to MSC Industrial Direct’s balance sheet here.
Valuation: we made $1.3 billion of adjustments with a net effect of decreasing shareholder value by $970 million. Apart from total debt which includes the operating leases noted above, one of the most notable adjustments to shareholder value was $189 million in excess cash. This adjustment represents 5% of MSC Industrial Direct’s market value. See all adjustments to MSC Industrial Direct’s valuation here.
This article originally published on July 31, 2020.
Disclosure: David Trainer, Kyle Guske II, and Matt Shuler receive no compensation to write about any specific stock, style, or theme.
Follow us on Twitter, Facebook, LinkedIn, and StockTwits for real-time alerts on all our research.
[1] Harvard Business School features the powerful impact of our research automation technology in the case New Constructs: Disrupting Fundamental Analysis with Robo-Analysts.
[2] Compare our analytics on a mega cap company to Bloomberg and Capital IQ’s (SPGI) analytics in the detailed appendix of this paper.