
Four new stocks make November’s Exec Comp Aligned with ROIC Model Portfolio, available to members as of November 12, 2021.
Recap From September’s Picks
Our Exec Comp Aligned with ROIC Model Portfolio (+8.7%) outperformed the S&P 500 (4.8%) from October 14, 2021, through November 10, 2021. The best performing stock in the portfolio was up 34%. Overall, eight out of the 15 Exec Comp Aligned with ROIC Stocks outperformed the S&P 500 from October 14, 2021, through November 10, 2021.
More reliable & proprietary fundamental data, proven in The Journal of Financial Economics, drives our research and provides investors with a new source of alpha. Our proprietary Robo-Analyst technology[1] scales our forensic accounting expertise (featured in Barron’s) across thousands of stocks[2] to produce an unrivaled database of fundamental data.
This Model Portfolio only includes stocks that earn an Attractive or Very Attractive rating and align executive compensation with improving ROIC. We think this combination provides a uniquely well-screened list of long ideas because return on invested capital (ROIC) is the primary driver of shareholder value creation.
New Stock Feature for November: Polaris Inc. (PII: $121/share)
Polaris Inc. (PII) is the featured stock in November’s Exec Comp Aligned with ROIC Model Portfolio.
Since 2016, Polaris has posted compounded annual growth rates (CAGR) of 12% for revenue and 19% for net operating profit after tax (NOPAT), per Figure 1. The company’s NOPAT margin grew from 6% in 2016 to 8% over the trailing twelve-month (TTM) period. The company’s ROIC grew from 15% to 22% over the same time.
Figure 1: Polaris’s NOPAT & Revenue Growth: 2016 – TTM
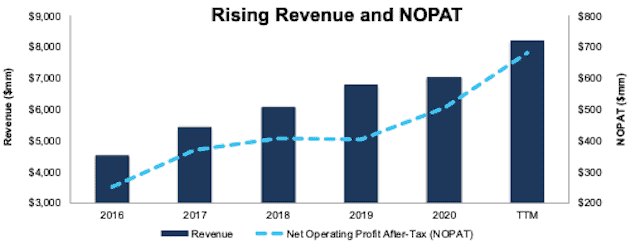
Sources: New Constructs, LLC and company filings
ROIC-Based Pay Properly Incentivizes Executives
Polaris’s executive compensation plan aligns executives’ interests with shareholder’s interests by tying the payout of performance restricted stock units to the achievement of a target adjusted ROIC.
Polaris’s inclusion of adjusted ROIC as an executive compensation performance goal has helped drive shareholder value creation through rising ROIC and economic earnings. Polaris’s ROIC improved from 15% in 2016 to 22% over the TTM, and the company’s economic earnings grew from $138 million to $483 million over the same period.
Figure 2: Polaris’s ROIC: 2016 – TTM
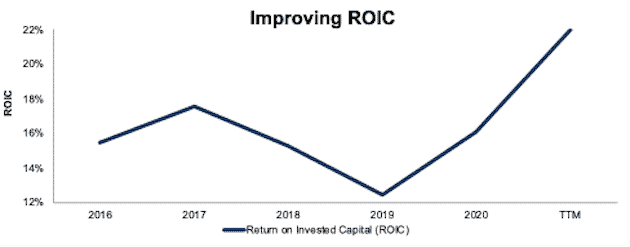
Sources: New Constructs, LLC and company filings
Polaris Is Undervalued
At its current price of $121/share, PII has a price-to-economic book value (PEBV) ratio of 0.8. This ratio means the market expects Polaris’s NOPAT to permanently decline by 20%. This expectation seems overly pessimistic for a company that has grown NOPAT by 9% compounded annually over the past two decades.
If Polaris can maintain 2020 NOPAT margins of 7% (margins were nearly 8% over the TTM) and grow NOPAT by 4.5% compounded annually over the next 10 years, then the stock is worth $148/share today – a 22% upside. See the math behind this reverse DCF scenario. Should the company grow NOPAT more in line with historical growth rates, the stock has even more upside.
Critical Details Found in Financial Filings by Our Robo-Analyst Technology
Below are specifics on the adjustments we make based on Robo-Analyst findings in Polaris’s 10-K and 10-Qs:
Income Statement: we made $557 million in adjustments, with a net effect of removing $381 million in non-operating expenses (5% of revenue). You can see all the adjustments made to Polaris’ income statement here.
Balance Sheet: we made $1.3 billion in adjustments to calculate invested capital with a net increase of $287 million. One of the largest adjustments was $411 million (15% of reported net assets) in asset write-downs. You can see all the adjustments made to Polaris’ balance sheet here.
Valuation: we made $1.9 billion in adjustments to shareholder value, all of which decreased shareholder value. Apart from total debt, the most notable adjustment to shareholder value was $144 million in outstanding employee stock options (ESO). This adjustment represents 2% of Polaris’s market cap. See all adjustments to Polaris’ valuation here.
This article originally published on November 19, 2021.
Disclosure: David Trainer, Kyle Guske II, Alex Sword, and Matt Shuler receive no compensation to write about any specific stock, style, or theme.
Follow us on Twitter, Facebook, LinkedIn, and StockTwits for real-time alerts on all our research.
[1] Harvard Business School features our research automation technology in the case Disrupting Fundamental Analysis with Robo-Analysts.
[2] See how our models overcome flaws in Bloomberg and Capital IQ’s (SPGI) analytics in the detailed appendix of this paper.