Eight new stocks make our Safest Dividend Yields Model Portfolio this month, which was made available to members on November 21, 2019.
Recap from October’s Picks
Our Safest Dividend Yields Model Portfolio outperformed the S&P 500 from October 23, 2019 through November 19, 2019. The Model Portfolio rose 4.3% on a price return basis and 4.7% on a total return basis. The S&P 500 rose 4.0% on a price return and total return basis. The best performing large cap stock was up 9%, and the best performing small cap stock was up 26%. Overall, 11 out of the 20 Safest Dividend Yield stocks outperformed the S&P 500 & Russell 2000 from October 23, 2019 through November 19, 2019.
Only our research utilizes the superior data and earnings adjustments featured by the HBS & MIT Sloan paper, "Core Earnings: New Data and Evidence.” This Model Portfolio leverages our Robo-Analyst technology[1], which scales our forensic accounting expertise (featured in Barron’s) across thousands of stocks.[2]
This Model Portfolio only includes stocks that earn an Attractive or Very Attractive rating, have positive free cash flow and economic earnings, and offer a dividend yield greater than 3%. Companies with strong free cash flow provide higher quality and safer dividend yields because we know they have the cash to support the dividend. We think this portfolio provides a uniquely well-screened group of stocks that can help clients outperform.
Featured Stock for November: Verizon Communications (VZ: $59/share)
Verizon Communications (VZ), is the featured stock in November’s Safest Dividend Yields Model Portfolio. We made VZ a Long Idea in September 2019 and the stock remains undervalued.
In 2018, VZ grew revenue by 4% year-over-year and after-tax operating profit (NOPAT) by 22% YoY, per Figure 1. Trailing twelve month (TTM) NOPAT is up 12% over the prior TTM period. Longer-term, VZ has grown NOPAT by 4% compounded annually over the past decade. Profit growth is driven by VZ’s NOPAT margin rising from 15% in 2008 to 18% TTM.
Figure 1: VZ’s Revenue & NOPAT Growth Since 2017
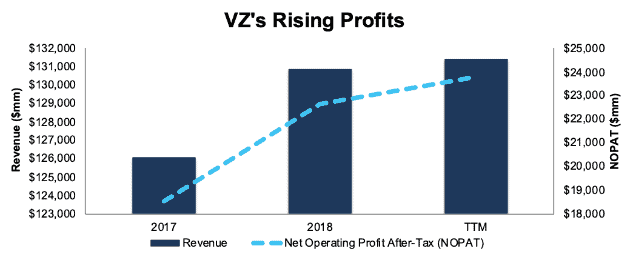
Sources: New Constructs, LLC and company filings
VZ’s Free Cash Flow Supports Dividend Payments
Verizon has increased its annual dividend payment in each of the last 12 years. Since 2014, VZ has increased its annual dividend from $2.16/share to $2.42/share TTM, or 2% compounded annually. This dividend payment has been supported by VZ’s cumulative free cash flow. VZ’s free cash flow decline came to an end in 2018, after the firm promoted former CTO Hans Vestburg to CEO and halted its value-destroying acquisition strategy. Since then, FCF has improved significantly, per Figure 2. From 2014-2018, VZ generated $50.7 billion (21% of market cap) in FCF while paying $44.8 billion in dividends.
Figure 2: VZ’s FCF vs. Dividends Since 2014
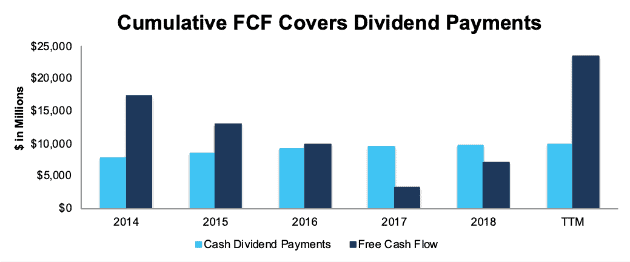
Sources: New Constructs, LLC and company filings
Companies with strong free cash flow provide higher quality dividend yields because we know the firm has the cash to support its dividend. On the flip side, dividends from companies with low or negative free cash flow cannot be trusted as much because the company may not be able to sustain paying dividends.
VZ Remains Undervalued
At its current price of $59/share, VZ has a price-to-economic book value (PEBV) ratio of 0.6. This ratio means the market expects VZ’s NOPAT to permanently decline by 40%. This expectation seems too pessimistic given that VZ grew NOPAT by 22% YoY in 2018, 11% YoY in the TTM period, and 9% compounded annually over the past two decades.
If VZ can maintain TTM NOPAT margins (18%) and grow NOPAT by just 2% compounded annually for the next decade, the stock is worth $110/share today – an 86% upside. See the math behind this reverse DCF scenario.
Critical Details Found in Financial Filings by Our Robo-Analyst Technology
As investors focus more on fundamental research, research automation technology is needed to analyze all the critical financial details in financial filings as shown in the Harvard Business School and MIT Sloan paper, "Core Earnings: New Data and Evidence”.
Below are specifics on the adjustments we make based on Robo-Analyst findings in Verizon Communication’s 2018 10-K:
Income Statement: we made $21.6 billion of adjustments with a net effect of removing $7.1 billion in non-operating expense (5% of revenue). See all adjustments made to VZ’s income statement here.
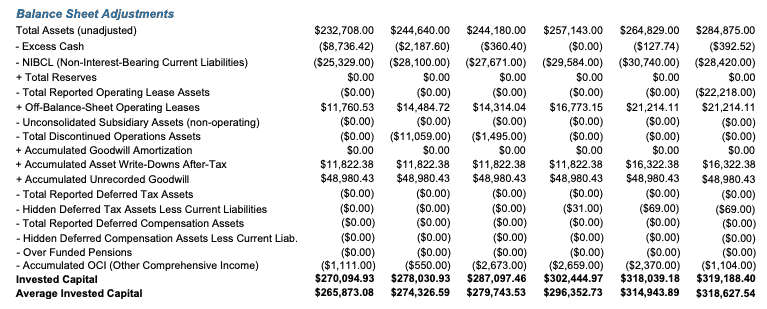
Balance Sheet: we made $172.9 billion of adjustments to calculate invested capital with a net increase of $83.3 billion. The most notable adjustment was $67.5 billion (30% of reported net assets) related to deferred taxes. See all adjustments to VZ’s balance sheet here.
Valuation: we made $190.6 billion of adjustments with a net effect of decreasing shareholder value by $189.8 billion. The largest adjustment to shareholder value was $137.2 billion in total debt, which includes $21.2 billion in operating leases. This lease adjustment represents 9% of VZ’s market value. See all adjustments to VZ’s valuation here.
This article originally published on November 27, 2019.
Disclosure: David Trainer, Kyle Guske II, and Sam McBride receive no compensation to write about any specific stock, style, or theme.
Follow us on Twitter, Facebook, LinkedIn, and StockTwits for real-time alerts on all our research.
[1] Harvard Business School features the powerful impact of our research automation technology in the case New Constructs: Disrupting Fundamental Analysis with Robo-Analysts.
[2] This paper compares our analytics on a mega cap company to other major providers. The Appendix details exactly how we stack up.