
Four new stocks make our Dividend Growth Stocks Model Portfolio this month, which was made available to members on September 29, 2021.
Recap From September’s Picks
On a price return basis, our Dividend Growth Stocks Model Portfolio (-1.9%) underperformed the S&P 500 (-0.8%) by 1.1% from August 26, 2021 through September 27, 2021. On a total return basis, the Model Portfolio (-1.5%) underperformed the S&P 500 (-0.5%) by 1.0% over the same time. The best performing stock was up 6%. Overall, 12 out of the 30 Dividend Growth Stocks outperformed the S&P 500 from August 26, 2021 through September 27, 2021.
More reliable & proprietary fundamental data, proven in The Journal of Financial Economics, drives our research. Our proprietary Robo-Analyst technology[1] scales our forensic accounting expertise (featured in Barron’s) across thousands of stocks[2] to produce an unrivaled database of fundamental data.
The methodology for this model portfolio mimics an All Cap Blend style with a focus on dividend growth. Selected stocks earn an Attractive or Very Attractive rating, generate positive free cash flow (FCF) and economic earnings, offer a current dividend yield >1%, and have a 5+ year track record of consecutive dividend growth. This model portfolio is designed for investors who are more focused on long-term capital appreciation than current income, but still appreciate the power of dividends, especially growing dividends.
Featured Stock From September: Kearny Financial Corp (KRNY: $13/share)
Kearny Financial Corp (KRNY) is the featured stock from September’s Dividend Growth Stocks Model Portfolio.
Kearny Financial has grown revenue by 9% compounded annually and net operating profit after-tax (NOPAT) by 18% compounded annually over the past decade. Longer term, the firm has grown NOPAT by 8% compounded annually since fiscal 2005. The firm’s NOPAT margin rose from 13% in fiscal 2015 to 27% in fiscal 2021.
Figure 1: Kearny Financial’s NOPAT & Revenue Since Fiscal 2015
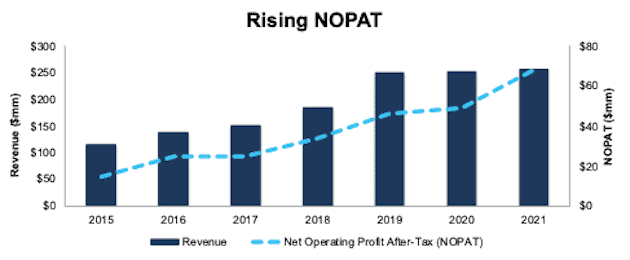
Sources: New Constructs, LLC and company filings
Steady Dividend Growth Supported by FCF
Kearny Financial has increased its regular dividend from $0.08/share in fiscal 2016 to $0.35/share in fiscal 2021, or 34% compounded annually. The current quarterly dividend, when annualized, equals $0.40/share and provides a 3.1% dividend yield.
More importantly, Kearny Financial’s strong free cash flow (FCF) supports the firm’s growing dividend payments. Kearny Financial generated a cumulative $313 million (32% of current market cap) in FCF while paying $123 million in dividends from fiscal 2016 to fiscal 2021, per Figure 2.
Figure 2: Free Cash Flow vs. Regular Dividend Payments
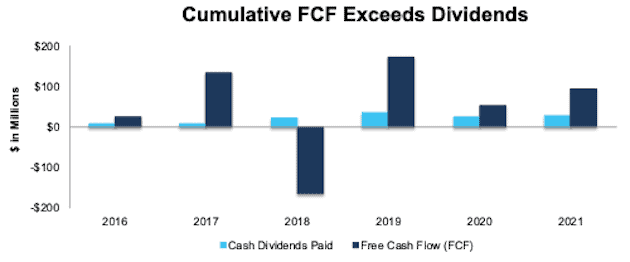
Sources: New Constructs, LLC and company filings
Companies with FCF well in excess of dividend payments provide higher quality dividend growth opportunities because we know the firm generates the cash to support a higher dividend. On the other hand, the dividend of a company where FCF falls short of the dividend payment over time cannot be trusted to grow or even maintain its dividend because of inadequate free cash flow.
KRNY Has Upside Potential
At its current price of $13/share, KRNY has a price-to-economic book value (PEBV) ratio of 0.6. This ratio means the market expects Kearny Financial’s NOPAT to permanently decline by 40%. This expectation seems overly pessimistic for a firm that has grown NOPAT by 8% compounded annually over the past two decades.
Even if Kearny Financial’s NOPAT margin falls to 17% (equal to 5-year low, compared to 27% TTM) and the firm’s NOPAT grows by just 4% compounded annually for the next decade, the stock is worth $27/share today – a 108% upside. See the math behind the reverse DCF scenario.
Should the firm grow NOPAT more in line with historical growth rates, the stock has even more upside. Add in Kearny Financial’s 3.1% dividend yield and history of dividend growth, and it’s clear why this stock is in September’s Dividend Growth Stocks Model Portfolio.
Critical Details Found in Financial Filings by Our Robo-Analyst Technology
Fact: we provide superior fundamental data and earnings models – unrivaled in the world.
Proof: Core Earnings: New Data and Evidence, published in The Journal of Financial Economics.
Below are specifics on the adjustments we make based on Robo-Analyst findings in Kearny Financial’s fiscal 2021 10-K:
Income Statement: we made $13 million in adjustments with a net effect of removing $5 million in non-operating expenses (2% of revenue). See all adjustments made to Kearny Financial’s income statement here.
Balance Sheet: we made $159 million of adjustments to calculate invested capital with a net increase of $83 million. The most notable adjustment was $58 million (5% of reported net assets) in total reserves. See all adjustments to Kearny Financial’s balance sheet here.
Valuation: we made $25 million in adjustments to shareholder value, all of which decreased shareholder value. Other than total debt, the most notable adjustment to shareholder value was $6 million in underfunded pensions. This adjustment represents <1% of Kearny Financial’s market value. See all adjustments to Kearny Financial’s valuation here.
This article originally published on October 7, 2021.
Disclosure: David Trainer, Kyle Guske II, Alex Sword, and Matt Shuler receive no compensation to write about any specific stock, style, or theme.
Follow us on Twitter, Facebook, LinkedIn, and StockTwits for real-time alerts on all our research.
[1] Harvard Business School features our research automation technology in the case Disrupting Fundamental Analysis with Robo-Analysts.
[2] See how our models and financial ratios are superior to Bloomberg and Capital IQ’s (SPGI) analytics in the detailed appendix of this paper.