
Two new stocks made September’s Exec Comp Aligned with ROIC Model Portfolio, available to members as of September 15, 2022.
Recap From August’s Picks
Our Exec Comp Aligned with ROIC Model Portfolio (-8.9%) underperformed the S&P 500 (-8.1%) from August 12, 2022 through September 13, 2022. The best performing stock in the portfolio was up 7%. Overall, six out of the 15 Exec Comp Aligned with ROIC stocks outperformed the S&P 500 from August 12, 2022 through September 13, 2022.
This report leverages our cutting-edge Robo-Analyst technology to deliver proven-superior[1] fundamental research and support more cost-effective fulfillment of the fiduciary duty of care.
This Model Portfolio includes stocks that earn an Attractive or Very Attractive rating and align executive compensation with improving ROIC. This combination provides a uniquely well-screened list of long ideas because the primary driver of shareholder value creation is return on invested capital (ROIC).
New Feature Stock for September: The Home Depot, Inc. (HD: $272/share)
The Home Depot, Inc. (HD) is the featured stock in September’s Exec Comp Aligned with ROIC Model Portfolio. We made HD a Long Idea on September 8, 2022. Since then, the stock is down 9% compared to a 5% decline for the S&P 500.
Home Depot grew revenue and net operating profit after tax (NOPAT) by 8% and 15% compounded annually, respectively, over the past ten years. The company’s NOPAT margin rose from 6% in fiscal 2011 to 12% over the trailing-twelve-months (TTM), while invested capital turns rose from 1.9 to 2.9 over the same time. Rising NOPAT margins and invested capital turns drive ROIC from 12% in fiscal 2011 to 36% TTM.
Figure 1: Home Depot’s Revenue & NOPAT: Fiscal 2011 – TTM
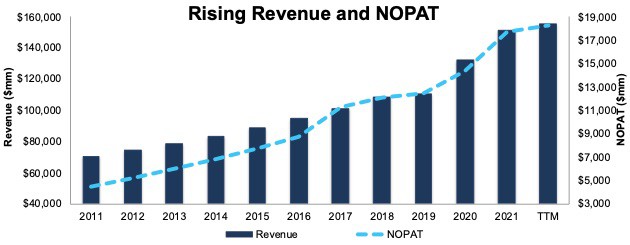
Sources: New Constructs, LLC and company filings
Executive Compensation Properly Aligns Executive Incentives
Home Depot’s executive compensation plan aligns executives’ interests with shareholders’ interests by tying the payout of equity awards to a three-year return on invested capital (ROIC) target.
Home Depot’s inclusion of ROIC as a performance goal has helped create shareholder value through rising ROIC and economic earnings. Home Depot’s ROIC improved from 23% in fiscal 2016 to 36% over the TTM, and the company’s economic earnings rose from $6.7 billion to $15.1 billion over the same period.
Figure 2: Home Depot’s ROIC: Fiscal 2016 – TTM
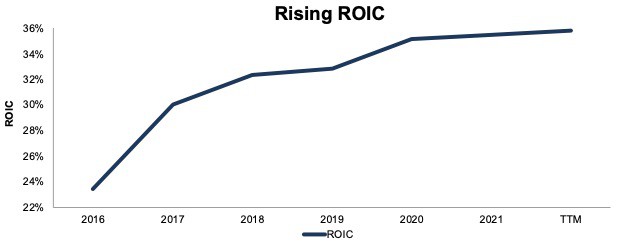
Sources: New Constructs, LLC and company filings
Home Depot Is Undervalued
At its current price of $272/share, HD has a price-to-economic book value (PEBV) ratio of 1.2. This ratio means the market expects Home Depot’s NOPAT to grow by no more than 20%. This expectation seems overly pessimistic for a company that has grown NOPAT by 15% compounded annually over the past decade and 9% compounded annually over the past 20 years.
If Home Depot maintains its TTM NOPAT margin of 12%, and the company grows NOPAT by just 5% compounded annually over the next 15 years, the stock would be worth $390+/share today – a 43% upside. See the math behind this reverse DCF scenario. Should the company grow NOPAT more in line with historical growth rates, the stock has even more upside.
Critical Details Found in Financial Filings by Our Robo-Analyst Technology
Below are specifics on the adjustments we make based on Robo-Analyst findings in Home Depot’s 10-Qs and 10-Ks:
Income Statement: we made $2.0 billion in adjustments, with a net effect of removing $1.3 billion in non-operating expenses (1% of revenue). Clients can see all adjustments made to Home Depot’s income statement on the GAAP Reconciliation tab on the Ratings page on our website.
Balance Sheet: we made $6.3 billion in adjustments to calculate invested capital with a net increase of $5.6 billion. One of the largest adjustments was $1.1 billion (2% of reported net assets) in asset write-downs. Clients can see all adjustments made to Home Depot’s balance sheet on the GAAP Reconciliation tab on the Ratings page on our website.
Valuation: we made $48.3 billion in adjustments, all of which decreased shareholder value. Apart from total debt, the most notable adjustment to shareholder value was $565 million in deferred tax liabilities. This adjustment represents <1% of Home Depot’s market cap. Clients can see all adjustments to Home Depot’s valuation on the GAAP Reconciliation tab on the Ratings page on our website.
This article originally published on September 22, 2022.
Disclosure: David Trainer, Kyle Guske II, Matt Shuler, and Brian Pellegrini receive no compensation to write about any specific stock, style, or theme.
Follow us on Twitter, Facebook, LinkedIn, and StockTwits for real-time alerts on all our research.
[1] Our research utilizes our Core Earnings, a more reliable measure of profits, as proven in Core Earnings: New Data & Evidence, written by professors at Harvard Business School (HBS) & MIT Sloan and published in The Journal of Financial Economics.