
Recap from March’s Picks
Our Most Attractive Stocks (-4.5%) outperformed the S&P 500 (-5.3%) as a long portfolio last month. Most Attractive Large Cap stock Humana Inc. (HUM) gained 3%. Most Attractive Small Cap stock Fonar Corporation (FONR) was up 14%. Overall, 22 out of the 40 Most Attractive stocks outperformed the S&P 500 in March.
Our Most Dangerous Stocks (-5.9%) outperformed the S&P 500 (-5.3%) as a short portfolio last month. Most Dangerous Large Cap stock Summit Materials (SUM) fell by 12% and Most Dangerous Small Cap Stock Consolidated Communications (CNSL) fell by 16%. Overall, 21 out of the 40 Most Dangerous stocks outperformed the S&P 500 in March, and 36 had negative returns.
The successes of these model portfolios highlight the value of our machine learning and AI Robo-Analyst technology[1], which helps clients fulfill the fiduciary duty of care and make smarter investments[2].
16 new stocks make our Most Attractive list this month and 17 new stocks fall onto the Most Dangerous list this month. April’s Most Attractive and Most Dangerous stocks were made available to members on April 4, 2018.
Our Most Attractive stocks have high and rising returns on invested capital (ROIC) and low price to economic book value ratios. Most Dangerous stocks have misleading earnings and long growth appreciation periods implied by their market valuations.
Most Attractive Stocks Feature for April: Winmark Corp (WINA: $130/share)
Winmark Corp (WINA), a specialty consignment retailer, is the featured stock from April’s Most Attractive Stocks Model Portfolio. WINA was also a featured Long Idea in October 2017 and is currently in our Focus List – Long Model Portfolio.
Over the past decade, WINA has grown revenue 8% compounded annually while after-tax profit (NOPAT) has grown 21% compounded annually. Increased profit growth can be attributed to WINA’s NOPAT margin rising from 11% in 2007 to 35% in 2017. The company has also improved its ROIC from 8% in 2007 to 42% in 2017.
Figure 1: WINA’s Revenue & NOPAT Since 2006
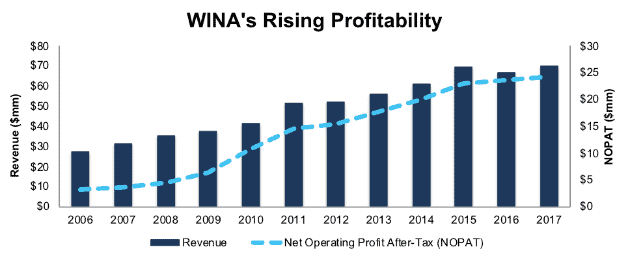
Sources: New Constructs, LLC and company filings
WINA Valuation Provides Upside
Despite outperforming over the past two years (up 31% vs. 29% for the S&P 500), WINA remains undervalued. At its current price of $130/share, WINA has a price-to-economic book value (PEBV) ratio of 1.0. This ratio means the market expects WINA’s NOPAT to never meaningfully grow from its current levels. This expectation seems rather pessimistic given that WINA has grown NOPAT by 13% compounded annually since 1996.
If WINA can maintain 2017 NOPAT margins (35%) and grow NOPAT by just 4% compounded annually over the next decade, the stock is worth $185/share today – a 42% upside. Here’s the math behind this dynamic DCF scenario.
Critical Details Found in Financial Filings By Our Robo-Analyst Technology
As investors focus more on fundamental research, research automation technology is needed to analyze all the critical financial details in financial filings. Below are specifics on the adjustments we make based on Robo-Analyst findings in Winmark Corp’s 2017 10-K:
Income Statement: we made $5 million of adjustments, with a net effect of removing $1 million in non-operating income (1% of revenue). We removed $3 million in non-operating income and $2 million in non-operating expenses. You can see all the adjustments made to WINA’s income statement here.
Balance Sheet: we made $19 million of adjustments to calculate invested capital with a net increase of $19 million. One of the largest adjustments was $13 million due to asset write-downs. This adjustment represented 33% of reported net assets. You can see all the adjustments made to WINA’s balance sheet here.
Valuation: we made $94 million of adjustments with a net effect of decreasing shareholder value by $94 million. There were no adjustments that increased shareholder value. The largest adjustment to shareholder value was $22 million in outstanding employee stock options. This adjustment represents 4% of WINA’s market cap. Despite the decrease in shareholder value, WINA remains undervalued.
Most Dangerous Stocks Feature: Darling Ingredients (DAR: $17/share)
Darling Ingredients (DAR), a producer of natural ingredients from edible and inedible bio-nutrients, is the featured stock from April’s Most Dangerous Stocks Model Portfolio.
Since 2011, DAR’s revenue grew 13% compounded annually while its economic earnings, the true cash flows of the business, fell from $112 million to -$160 million. DAR’s NOPAT margin fell from 11% in 2011 to 3% in 2017 while its ROIC fell from 15% to a bottom-quintile 3% over the same time.
Figure 2: DAR’s Revenue & Economic Earnings Since 2011
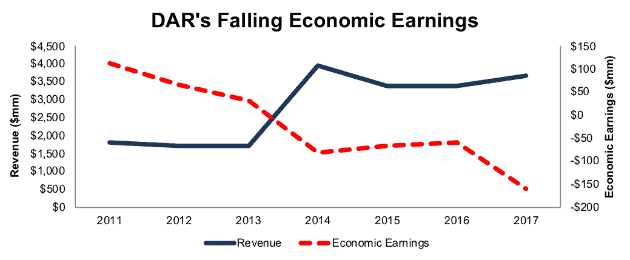
Sources: New Constructs, LLC and company filings
DAR Provides Poor Risk/Reward Tradeoff
Over the past five years, DAR has significantly unperformed the S&P 500 (+3% vs. S&P +70%). Even now, shares still hold significant downside risk given the deteriorating fundamentals.
To justify its current price of $17/share, DAR must maintain 2017 NOPAT margins (3%) and grow NOPAT by 8% compounded annually for the next 17 years. This scenario seems overly optimistic after years of margin decline and the fact that DAR’s NOPAT has fallen by 8% compounded annually since 2011. Here’s the math behind this dynamic DCF scenario.
Even if we assume DAR can achieve 5% NOPAT margins (average of last five years) and grow NOPAT by 8% compounded annually for the next decade, the stock is worth just $ 11/share today – a 35% downside. See the math behind this DCF scenario here.
Critical Details Found in Financial Filings By Our Robo-Analyst Technology
As investors focus more on fundamental research, research automation technology is needed to analyze all the critical financial details in financial filings. Below are specifics on the adjustments we make based on Robo-Analyst findings in Darling Ingredient’s 2017 10-K:
Income Statement: we made $256 million of adjustments, with a net effect of removing $8 million in non-operating income (<1% of revenue). We removed $132 million in non-operating income and $124 million in non-operating expenses. You can see all the adjustments made to DAR’s income statement here.
Balance Sheet: we made $437 million of adjustments to calculate invested capital with a net increase of $387 million. One of the largest adjustments was $212 million due to other comprehensive income. This adjustment represented 5% of reported net assets. You can see all the adjustments made to DAR’s balance sheet here.
Valuation: we made $2.3 billion of adjustments with a net effect of decreasing shareholder value by $2.3 billion. There were no adjustments that increased shareholder value. Apart from total debt, which includes $128 million in operating leases, the largest adjustment to shareholder value was $253 million in deferred tax liabilities. This adjustment represents 9% of DAR’s market cap.
This article originally published on April 10, 2018.
Disclosure: David Trainer and Kyle Guske II receive no compensation to write about any specific stock, style, or theme.
Follow us on Twitter, Facebook, LinkedIn, and StockTwits for real-time alerts on all our research.
[1] Harvard Business School features the powerful impact of our research automation technology in the case New Constructs: Disrupting Fundamental Analysis with Robo-Analysts.
[2] Ernst & Young’s recent white paper “Getting ROIC Right” proves the superiority of our holdings research and analytics.
Click here to download a PDF of this report.
Photo Credit: journeyman62 (Flickr)