
Recap from January’s Picks
Our Most Attractive Stocks (-3.9%) underperformed the S&P 500 (+1.9%) from January 7, 2020 through February 4, 2020. The best performing large cap stock gained 10% and the best performing small cap stock was up 4%. Overall, 7 out of the 40 Most Attractive stocks outperformed the S&P 500.
Our Most Dangerous Stocks (-1.6%) outperformed the S&P 500 (+1.9%) as a short portfolio from January 7, 2020 through February 4, 2020. The best performing large cap stock fell by 8% and the best performing small cap stock fell by 14%. Overall, 23 out of the 36 Most Dangerous stocks outperformed the S&P 500 as shorts.
Only our research utilizes the superior data and earnings adjustments featured by the HBS & MIT Sloan paper, "Core Earnings: New Data and Evidence.” The successes of these model portfolios highlight the value of our machine learning and AI Robo-Analyst technology[1], which helps clients fulfill the fiduciary duty of care and make smarter investments[2].
15 new stocks make our Most Attractive list this month, and two new stocks fall onto the Most Dangerous list this month. February’s Most Attractive and Most Dangerous stocks were made available to members on February 6, 2020.
Our Most Attractive stocks have high and rising returns on invested capital (ROIC) and low price to economic book value ratios. Most Dangerous stocks have misleading earnings and long growth appreciation periods implied by their market valuations.
Most Attractive Stocks Feature for February: AutoZone Inc. (AZO: $1,059/share)
AutoZone Inc. (AZO), is the featured stock from February’s Most Attractive Stocks Model Portfolio. We most recently made AZO a Long Idea in November 2018. The stock is up 34% (S&P 500 +19%) since our report and remains undervalued.
Over the past decade, AZO has grown after-tax profit (NOPAT) by 8% compounded annually. AZO’s trailing twelve month (TTM) NOPAT is up 14% over the prior TTM period. AZO’s NOPAT margin has increased from 12% in 2009 to 15% TTM while its ROIC improved from 19% to 26% over the same time.
Figure 1: AZO’s Revenue & NOPAT Since 2009
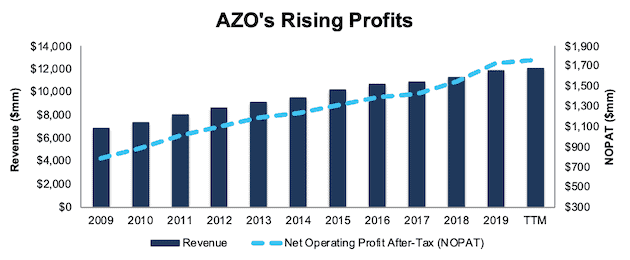
Sources: New Constructs, LLC and company filings
AZO’s Valuation Offers Upside Potential
At its current price of $1,059/share, AZO has a price-to-economic book value (PEBV) ratio of 0.8. This ratio means the market expects AZO’s NOPAT to permanently decline by 20%. This expectation seems overly pessimistic for a firm that has grown NOPAT by 8% compounded annually over the past decade and 10% compounded annually over the past two decades.
If AZO can maintain its TTM NOPAT margin (15%) and grow NOPAT by just 4% compounded annually for the next decade, the stock is worth $1,970/share today – an 86% upside. See the math behind this reverse DCF scenario.
Critical Details Found in Financial Filings by Our Robo-Analyst Technology
As investors focus more on fundamental research, research automation technology is needed to analyze all the critical financial details in financial filings as shown in the Harvard Business School and MIT Sloan paper, "Core Earnings: New Data and Evidence”.
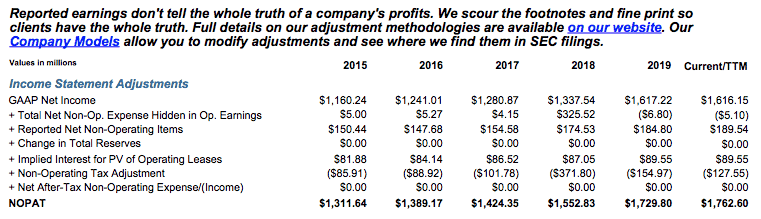
Below are specifics on the adjustments we make based on Robo-Analyst findings in AutoZone’s 2019 10-K:
Income Statement: we made $454 million of adjustments, with a net effect of removing $113 million in non-operating expense (<1% of revenue). You can see all the adjustments made to AZO’s income statement here.
Balance Sheet: we made $2.5 billion of adjustments to calculate invested capital with a net increase of $2.3 billion. One of the largest adjustments was $1.8 billion due to operating leases. This adjustment represented 40% of reported net assets. You can see all the adjustments made to AZO’s balance sheet here.
Valuation: we made $8.1 billion of adjustments with a net effect of decreasing shareholder value by $8.1 billion. There were no adjustments that increased shareholder value. Apart from total debt, which includes the operating leases noted above, the largest adjustment to shareholder value was $556 million in outstanding employee stock options. This adjustment represents 2% of AZO’s market cap. See all adjustments to AZO’s valuation here.
Most Dangerous Stocks Feature: Altra Industrial Motion Corp (AIMC: $35/share)
Altra Industrial Motion Corp (AIMC) is the featured stock from February’s Most Dangerous Stocks Model Portfolio.
AIMC’s economic earnings have declined from $16 million in 2011 to -$131 million TTM. The disconnect between economic earnings and GAAP net income, per Figure 2, stems from the increased capital charge related to AIMC’s $2.5 billion acquisition of A&S Business in 2018. This acquisition failed to create shareholder value and is detrimental to the firm’s overall profitability. AIMC’s average invested capital turns fell from 0.99 in 2017, the year before the acquisition, to 0.46 TTM while ROIC declined from 8% to 4% over the same time.
Figure 2: AIMC’s GAAP Net Income vs. Economic Earnings Since 2016
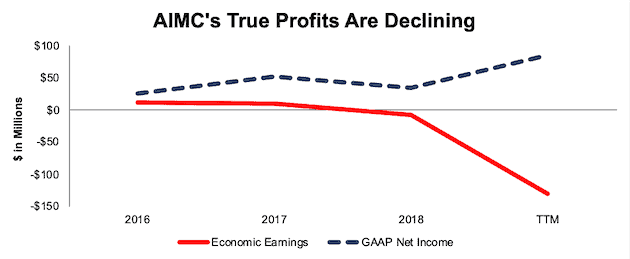
Sources: New Constructs, LLC and company filings
AIMC Provides Poor Risk/Reward
Despite its deteriorating fundamentals, AIMC is still priced for significant profit growth.
To justify its current price of $35/share, AIMC must achieve a NOPAT margin of 10% (compared to 9% TTM, which is the highest in the firm’s history) and grow NOPAT by 12% compounded annually for the next 12 years. See the math behind this reverse DCF scenario. This expectation seems overly optimistic given that AIMC’s NOPAT has grown by just 7% compounded annually over the past decade.
Even if we assume AIMC can maintain a 9% NOPAT margin (highest ever) and grow NOPAT by 11% compounded annually for the next decade, the stock is worth only $22/share today – a 37% downside. See the math behind this reverse DCF scenario.
Critical Details Found in Financial Filings by Our Robo-Analyst Technology
As investors focus more on fundamental research, research automation technology is needed to analyze all the critical financial details in financial filings as shown in the Harvard Business School and MIT Sloan paper, "Core Earnings: New Data and Evidence”.
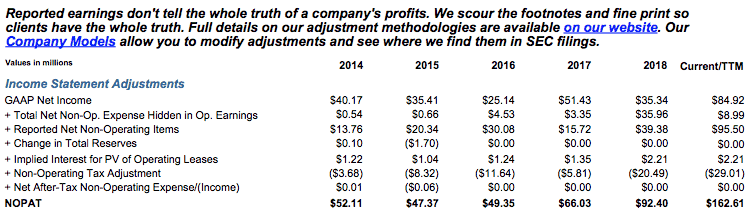
Below are specifics on the adjustments we make based on Robo-Analyst findings in Altra Industrial Motion Corp’s 2018 10-K:
Income Statement: we made $98 million of adjustments, with a net effect of removing $57 million in non-operating expense (5% of revenue). You can see all the adjustments made to AIMC’s income statement here.
Balance Sheet: we made $2.7 billion of adjustments to calculate invested capital with a net decrease of $2.3 billion. One of the largest adjustments was $2.4 billion related to mid-year acquisitions. This adjustment represented 60% of reported net assets. You can see all the adjustments made to AIMC’s balance sheet here.
Valuation: we made $2.2 billion of adjustments with a net effect of decreasing shareholder value by $2.0 billion. Apart from total debt, the largest adjustment to shareholder value was $394 million in net deferred tax liabilities. This adjustment represents 17% of AIMC’s market cap. See all adjustments to AIMC’s valuation here.
This article originally published on February 10, 2020.
Disclosure: David Trainer and Kyle Guske II, and Matt Shuler receive no compensation to write about any specific stock, style, or theme.
Follow us on Twitter, Facebook, LinkedIn, and StockTwits for real-time alerts on all our research.
[1] Harvard Business School features the powerful impact of our research automation technology in the case New Constructs: Disrupting Fundamental Analysis with Robo-Analysts.
[2] This paper compares our analytics on a mega cap company to Bloomberg and Capital IQ (SPGI) in a detailed appendix.