
Three new stocks make June’s Exec Comp Aligned with ROIC Model Portfolio, available to members as of June 15, 2018.
Recap from May’s Picks
Our Exec Comp Aligned with ROIC Model Portfolio (+1.9%) underperformed the S&P 500 (+2.0%) last month. The best performing stock in the portfolio was The Home Depot (HD), which was up 8%. Overall, Eight out of the 15 Exec Comp Aligned with ROIC Stocks outperformed the S&P in May.
Since inception, this model portfolio is up 29% while the S&P 500 is up 28%.
The success of this Model Portfolio highlights the value of our Robo-Analyst technology[1], which scales our forensic accounting expertise (featured in Barron’s) across thousands of stocks.
This Model Portfolio only includes stocks that earn an Attractive or Very Attractive rating and align executive compensation with improving ROIC. We think this combination provides a uniquely well-screened list of long ideas because return on invested capital (ROIC) is the primary driver of shareholder value creation.[2]
New Stock Feature for June: Lear Corp (LEA: $202/share)
Lear Corp (LEA), an automotive seating and electrical systems manufacturer, is the featured stock in June’s Exec Comp Aligned with ROIC Model Portfolio. Lear Corp was previously featured as a Long Idea on June 22, 2016 and reiterated on September 22, 2017 and again on October 31, 2017. Since the original Long Idea report, LEA is up 79% (vs. S&P up 27%) and still remains undervalued. The mix of strong fundamentals and undervalued stock price also earns LEA a spot in our Focus List – Long Model Portfolio.
Since 2010, LEA has grown revenue by 8% compounded annually and after-tax operating profit (NOPAT) by 12% compounded annually. LEA has grown profits faster than revenue by increasing its NOPAT margin from 5% in 2010 to 7% over the last twelve months (TTM). Further highlighting the strength of its business, LEA has generated cumulative free cash flow (FCF) of $2.1 billion (15% of market cap) over the past five years.
Figure 1: LEA’s Revenue & NOPAT Since 2010
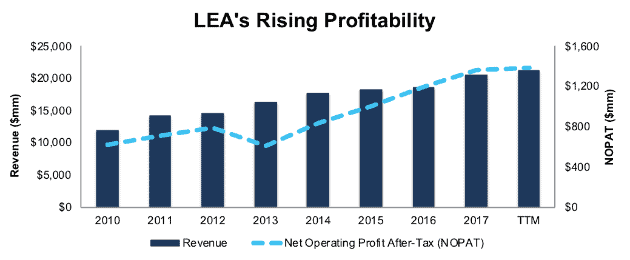
Sources: New Constructs, LLC and company filings
Executive Compensation Plan Helps Drive Shareholder Value Creation
Lear Corp has included ROIC as a performance metric in its executive compensation plan since 2010. In 2017, two-thirds of long-term incentive awards were tied directly to achieving a target ROIC. Long-term awards made up 54% of the CEO’s pay and 44% of other executives’ pay in 2017.
LEA management believes that tying executive compensation to ROIC “provides long-term focus on generating adequate returns on capital balanced by the goal of profitable growth embedded in the annual incentive performance measures.” The company notes that the “desired goal is to generate returns in excess of the company’s cost of capital.”
This focus on ROIC has led to Lear Corp earning an average ROIC of 19% since 2010. ROIC has actually improved from 14% in 2013 to 20% TTM. Lear Corp’s executive compensation plan lowers the risk of investing in the company’s stock because we know executives’ interests are tied to shareholders’ interests.
Valuation Still Provides Upside Potential
At its current price of $202/share, LEA has a price-to-economic book value (PEBV) ratio of 0.8. This ratio means the market expects LEA’s NOPAT to permanently decline by 20%. Such an expectation seems pessimistic given LEA’s ability to grow NOPAT by 12% compounded annually since 2010.
If LEA can maintain TTM NOPAT margins (7%) and grow NOPAT by just 4% compounded annually for the next decade, the stock is worth $263/share today – a 30% upside. See the math behind this dynamic DCF scenario here.
Critical Details Found in Financial Filings By Our Robo-Analyst Technology
As investors focus more on fundamental research, research automation technology is needed to analyze all the critical financial details in financial filings. Below are specifics on the adjustments we make based on Robo-Analyst findings in Lear Corp’s 2017 10-K:
Income Statement: we made $762 million of adjustments, with a net effect of removing $70 million in non-operating expense (<1% of revenue). We removed $346 million in non-operating income and $416 million in non-operating expenses. You can see all the adjustments made to LEA’s income statement here.
Balance Sheet: we made $2.7 billion of adjustments to calculate invested capital with a net decrease of $280 million. One of the largest adjustments was $647 million in deferred tax assets. This adjustment represented 9% of reported net assets. You can see all the adjustments made to LEA’s balance sheet here.
Valuation: we made $3.2 billion of adjustments with a net effect of decreasing shareholder value by $3 billion. The largest adjustment to shareholder value was $2.4 billion in total debt, which includes $451 million in operating leases. This lease adjustment represents 3% of LEA’s market cap. Despite the net decrease in shareholder value, LEA remains undervalued.
This article originally published on June 19, 2018.
Disclosure: David Trainer, Kyle Guske II, and Sam McBride receive no compensation to write about any specific stock, style, or theme.
Follow us on Twitter, Facebook, LinkedIn, and StockTwits for real-time alerts on all our research.
[1] Harvard Business School features the powerful impact of our research automation technology in the case New Constructs: Disrupting Fundamental Analysis with Robo-Analysts.
[2] Ernst & Young’s recent white paper, “Getting ROIC Right”, proves the superiority of our research and analytics.
Click here to download a PDF of this report.
Photo Credit: learningvideo.com (Flickr)