We published an update on this Long Idea on May 12, 2021. A copy of the associated Earnings Update report is here.
Finding undervalued firms in a beaten down industry is a staple of true value investing. Impressive profit growth and a valuation well below peers helped land this stock on July’s Most Attractive Stocks list. Even better, aligning executive compensation with return on invested capital (ROIC) earns the stock a spot on July’s Linking Exec Comp to ROIC Model Portfolio. Lear Corporation (LEA: $113/share) is also this week’s Long Idea.
Impressive Profit Growth
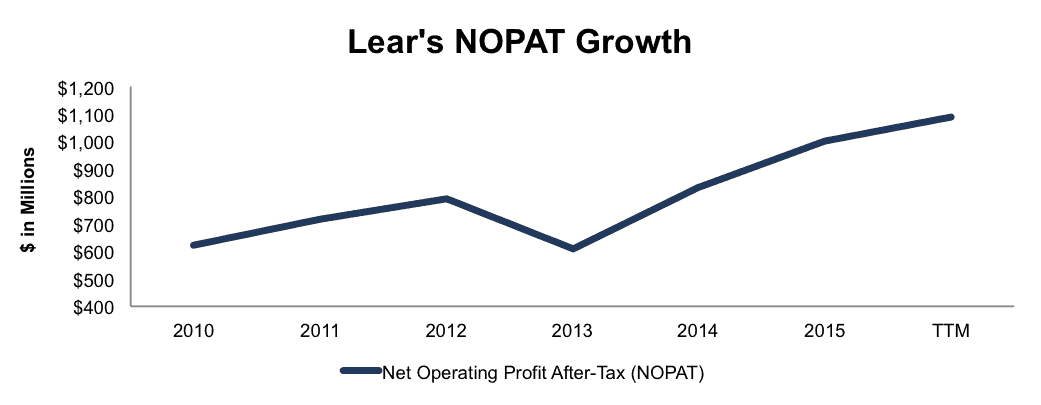
Since 2010, Lear Corp’s after-tax profit (NOPAT) has grown by 10% compounded annually to $1 billion in 2015 and $1.1 billion over the last twelve months. Lear’s NOPAT margin has seen slight improvement, from 5% in 2010 to 6% TTM. See Figure 1.
Figure 1: Lear Corp’s Rising Profits
Sources: New Constructs, LLC and company filings
Further highlighting the strength of Lear’s business, the company generated $1.1 billion in cumulative free cash flow since 2011 and earns a top-quintile 16% return on invested capital (ROIC) over the last twelve months.
Improvements In ROIC Correlated With Growing Shareholder Value
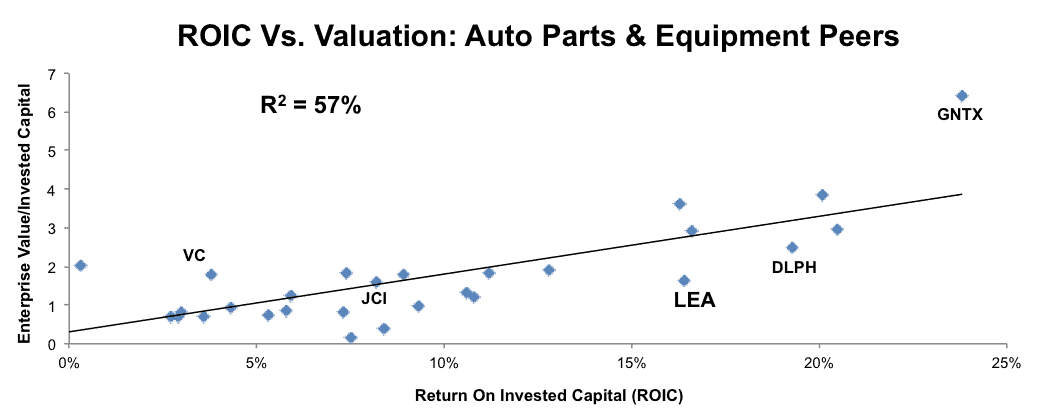
Lear Corp’s 16% ROIC is well above the 9% average of the 29 Auto Parts & Equipment companies under coverage. Earning a top-quintile ROIC is impressive, especially since ROIC is directly correlated with creating shareholder value. Figure 2 shows that ROIC explains 57% of the changes in stock valuation for those 29 Auto Parts & Equipment companies and that LEA is among the cheapest of this group. Considering Lear Corp links executive compensation to improvements in ROIC (more on this below), investors should be confident that executive interests are aligned with shareholders.
Figure 2: ROIC’s Correlation With Stock Valuation
Sources: New Constructs, LLC and company filings
Executive Compensation Tied To ROIC – Key To Creating True Value
Lear Corp’s executive compensation plan has recognized the importance of ROIC. Two-thirds of long-term incentive awards are directly tied to achieving a target ROIC. Long-term awards make up 52% of CEO pay and 44% of other executives’ pay. We would like to see an even greater amount of executive pay tied to ROIC, but as it stands, Lear Corp’s executive compensation plan is among the best we’ve seen at aligning the interests of executives with those of shareholders. Compared to firms whose plans focus solely on non-GAAP metrics or targets that have nothing to do with creating shareholder value, Lear’s plan lowers the risk of investing in the company’s stock because we know executives are held accountable for creating real profits.
Lear Corp’s Profitability Tops Main Competitor
Lear Corporation operates in two distinct segments, seating and electrical, which accounted for 77% and 23% of 2015 revenues, respectively. As such, it faces competition primarily from Johnson Controls (JCI), in house operations, and Faurecia S.A., Toyota Boshoku, and TS Tech, which are part owned by large auto manufacturers Peugeot, Toyota (TM), and Honda Motor. In the smaller electronics segment, Delphi Automotive (DLPH) and TE Connectivity (TEL) provide competition. As can be seen in Figure 3, Lear Corp earns a higher ROIC than its main competitor JCI. At the same time, it’s clear that the electronics segment (DLPH and TEL) provides higher margins than the seating segment. However, with the majority of Lear’s revenue coming from the seating segments, its superior margin and ROIC provide pricing power and operational flexibility.
Figure 3: Lear’s Strong Profitability
Sources: New Constructs, LLC and company filings.
Bear Concerns Should Not Apply Equally Throughout Industry
The greatest bear concern, as with any consumer discretionary stock, is the current and future state of the economy. As it pertains to Lear Corp, the health of the consumer and the willingness to purchase new vehicles directly impacts Lear’s results. Most bear arguments revolve around the lowered expectations of auto sales or weak sales data across different auto manufacturers. In fact in late June, Bank of America cut its U.S. auto sales forecast for 2016 and downgraded many auto parts suppliers in the process. However, this downgrade may be premature and should not be taken as a blanket statement across the entire industry.
In 2015, Ford (F) and General Motors (GM) accounted for 23% and 20% Lear’s net sales, respectively. Additionally, BMW accounted for an additional 10% of sales. For bears down on the entire auto industry, it’s worth noting the sales growth from each of these manufacturers through the first half of 2016:
- Ford’s U.S. sales are up 5% year-over-year and the firm achieved its best first half results in a decade.
- General Motor’s U.S. sales are up 1% year-over-year
- General Motor’s China sales are up 5% year-over-year
- BMW Global sales were up 6% year-over year
More recently, GM achieved record profits coupled with record sales in China when it reported 2Q16 results. It’s clear that Lear’s three biggest customers are having excellent starts to 2016. Worldwide in 1Q16, year-over year automotive production was up 5% in the U.S., up 3% in Europe and Africa, up 1% in Asia, and down 28% in South America. However, South America represented only 2% of Lear’s sales in 1Q16, thereby minimizing the impact of the region’s economic struggles.
Despite bear claims to the contrary, the automotive market is still on pace to set a new record in 2016. While concerns of an impending automotive collapse seem unfounded, that hasn’t stopped the market from pricing LEA as if its profits will significantly decline from 2015 levels, as we’ll show below.
Valuation Implies Automotive Collapse
LEA is down 7% year-to-date, as the market has bought into the negativity focused on the automotive market and ignored many positives. The disconnect between share price and the profits of the business has left LEA undervalued and creates a great buying opportunity. At its current price of $113/share, Lear Corp has a price to economic book value (PEBV) ratio of 0.7. This ratio means that the market expects Lear’s NOPAT to permanently decline 30% from current levels. This expectation runs contrary to Lear’s profit growth since 2010.
Even if Lear were to never again grow profits from current levels, the economic book value, or no growth value of the firm is $161/share – a 42% upside from current valuation.
However, if Lear can maintain TTM NOPAT margins (5.9%) and grow NOPAT by just 5% compounded annually for the next decade, the stock is worth $173/share today – a 54% upside. This scenario also assumes that Lear’s spending on working capital and fixed assets will be 3% of revenue, which is the average change in invested capital as a percent of revenue since 2010.
Buy Backs Plus Dividend Offer 9% Yield
Lear Corp has $845 million remaining under its current repurchase authorization, which expires end of year 2017. In 1Q16 alone, Lear repurchased $155 million worth of stock (2% of market cap) If Lear maintains its repurchase activity consistent with 1Q16, the remaining authorization will last just over 1 year and the firm would repurchase $620 million in stock in 2016. $620 million represents 7.4% of the current market cap, which provides investors a total yield of 9% when combined with Lear’s 1.1% dividend yield.
Automotive Strength and New Technology Will Propel Shares
Continued growth in total automobiles sold will have the largest impact on LEA. The first half of 2016 has provided a strong base with which to build upon, and if the firm can continue increasing its margins amidst growing sales, LEA will be an excellent long-term position.
However, the company’s success is not solely tied to increased purchases of automobiles. As technology in cars increases, with the introduction of Wi-Fi, infotainment systems, and ultimately autonomous vehicles, the need for complex wiring and safer seating solutions creates an excellent opportunity for Lear. The firm already supplies systems that connect the major electronic systems within a car, and the increasing complexity of these systems can directly lead to increases sales. In the meantime, investors are getting paid pretty well to wait given the 9% yield (dividend and buyback), which sure beats the current treasury yields and interest rates.
Insider Trends/ Short Sales Raise No Red Flags
Over the past 12 months, insiders have purchased 457,000 shares and sold 586,000 shares for a net effect of 129,000 insider shares sold. This amount represents less than 1% of shares outstanding. Additionally, short interest sits at 3.5 million shares, or just under 5% of shares outstanding.
Impact of Footnotes Adjustments and Forensic Accounting
In order to derive the true recurring cash flows, an accurate invested capital, and a real shareholder value, we made the following adjustments to Lear Corp’s 2015 10-K:
Income Statement: we made $521 million of adjustments with a net effect of removing $258 million in non-operating expenses (1% of revenue). We removed $390 million related to non-operating expenses and $131 million related to non-operating income. See all adjustments made to LEA’s income statement here.
Balance Sheet: we made $2.6 billion of adjustments to calculate invested capital with a net increase of $636 million. The most notable adjustment was $730 million (13% of net assets) related to other comprehensive income. See all adjustments to LEA’s balance sheet here.
Valuation: we made $3 billion of adjustments with a net effect of decreasing shareholder value by $2.5 billion. Despite this decrease in shareholder value, LEA remains undervalued. The largest adjustment to shareholder value was the removal of $2.3 billion in total debt, which includes $389 million in off balance sheet operating leases. This debt adjustment represents 27% of LEA’s market cap.
Attractive Funds That Hold LEA
The following funds receive our Attractive-or-better rating and allocate significantly to Lear Corp.
- WBI Tactical SMG Shares (WBIA) – 4.1% allocation and Attractive rating
- Catalyst/Lyons Hedged Premium Return Fund (CLPFX) – 3.0% allocation and Very Attractive rating
- WBI Tactical SMS Shares (WBID) – 2.8% allocation and Attractive rating.
- Federated MDT Mid Cap Growth Strategies Fund (FGSIX) – 2.6% allocation and Attractive rating.
- PowerShares DWA Consumer Cyclicals Momentum (PEZ) – 2.5% allocation and Very Attractive rating.
This report originally published here on July 22, 2016.
Disclosure: David Trainer and Kyle Guske II receive no compensation to write about any specific stock, style, or theme.
Click here to download a PDF of this report.
Photo Credit: NVIDIA Corporation (Flickr)


