
Recap from February’s Picks
Our Most Attractive Stocks (+3.5%) outperformed the S&P 500 (+1.5%) last month. Most Attractive Large Cap stock Micron Technology (MU) gained 24%. Most Attractive Small Cap stock Oclaro (OCLR) was up 11%. Overall, 21 out of the 40 Most Attractive stocks outperformed the S&P 500 in February.
Our Most Dangerous Stocks (+1.9%) underperformed the S&P 500 (+1.5%) as a short portfolio last month. Most Dangerous Large Cap stock Banco Bilbao Vizcaya Argentaria (BBVA) fell by 7% and Most Dangerous Small Cap Stock Seaspan Corp (SSW) fell by 14%. Overall, 18 out of the 40 Most Dangerous stocks outperformed the S&P 500 in February.
The successes of these model portfolios highlight the value of our machine learning and AI Robo-Analyst technology[1], which helps clients fulfill the fiduciary duty of care and make smarter investments[2].
31 new stocks make our Most Attractive list this month and 32 new stocks fall onto the Most Dangerous list this month. March’s Most Attractive and Most Dangerous stocks were made available to members on March 7, 2018.
Our Most Attractive stocks have high and rising returns on invested capital (ROIC) and low price to economic book value ratios. Most Dangerous stocks have misleading earnings and long growth appreciation periods implied by their market valuations.
Most Attractive Stocks Feature: Louisiana Pacific Corporation (LPX: $28/share)
Louisiana Pacific Corporation (LPX), a manufacturer of home construction building products, is the featured stock from March’s Most Attractive Stocks Model Portfolio.
Since 2014, LPX has grown revenue 12% compounded annually while after-tax profit (NOPAT) has increased from -$61 million to $412 million in 2017, per Figure 1. This profit growth can be attributed to LPX’s NOPAT margin rising from -3% in 2014 to 15% in 2017. The company has also improved its ROIC from -2% in 2014 to a top-quintile 19% in 2017. Longer-term, LPX has grown NOPAT by 13% compounded annually since 1998.
Figure 1: LPX Revenue & NOPAT Since 2014
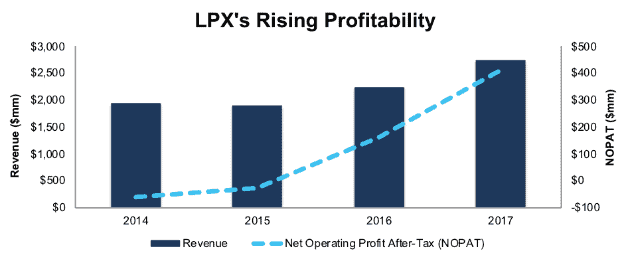
Sources: New Constructs, LLC and company filings
LPX Valuation Provides Significant Upside
Despite outperforming over the past two years (up 81% vs. 38% for the S&P) LPX remains undervalued. At its current price of $28/share, LPX has a price-to-economic book value (PEBV) ratio of 0.8. This ratio means the market expects LPX’s NOPAT to permanently decline by 20% from current levels.
If LPX can earn a 12% NOPAT margin (average of last two years, compared to 15% in 2017) and grow NOPAT by just 1% compounded annually over the next decade, the stock is worth $36/share today – a 29% upside.
Auditable Impact of Footnotes and Forensic Accounting Adjustments
Our Robo-Analyst technology enables us to perform forensic accounting with scale and provide the research needed to fulfill fiduciary duties. In order to derive the true recurring cash flows, an accurate invested capital, and an accurate shareholder value, we made the following adjustments to Louisiana Pacific’s 2017 10-K:
Income Statement: we made $90 million of adjustments, with a net effect of removing $22 million in non-operating expense (<1% of revenue). We removed $34 million in non-operating income and $56 million in non-operating expenses. You can see all the adjustments made to LPX’s income statement here.
Balance Sheet: we made $1.8 billion of adjustments to calculate invested capital with a net increase of $42 million. One of the largest adjustments was $699 million due to asset write-downs. This adjustment represented 32% of reported net assets. You can see all the adjustments made to LPX’s balance sheet here.
Valuation: we made $1.4 billion of adjustments with a net effect of increasing shareholder value by $244 million. The largest adjustment to shareholder value was $797 million in excess cash. This adjustment represents 19% of LPX’s market cap.
Most Dangerous Stocks Feature: Omnicell (OMCL: $44/share)
Omnicell (OMCL), a provider of automated medication dispensing solutions, is the featured stock from March’s Most Dangerous Stocks Model Portfolio.
Since 2014, OMCL’s revenue has grown 18% while NOPAT has fallen 39% compounded annually, per Figure 2. Profit decline can be attributed to OMCL’s NOPAT margin falling from 8% in 2014 to 1% in 2017. The firm’s ROIC has also fallen from 10% in 2014 to a bottom-quintile 1% in 2017.
Figure 2: OMCL Revenue & NOPAT Since 2014
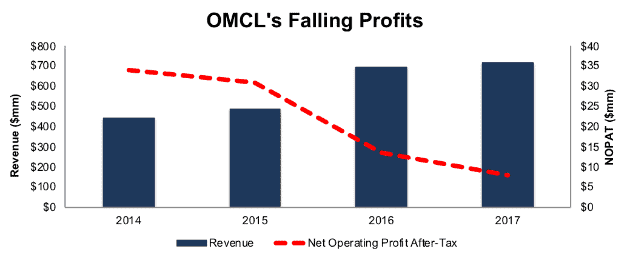
Sources: New Constructs, LLC and company filings
OMCL Provides Poor Risk/Reward Tradeoff
Despite the deteriorating fundamentals, OMCL is up 63% over the past two years while the S&P is up 38%. This outperformance has left OMCL significantly overvalued and shares now present significant downside risk.
To justify its current price of $44/share, OMCL must maintain current margins (1%) and grow NOPAT by 19% compounded annually for the next 19 years. This scenario assumes OMCL can grow revenue by 18% compounded annually over the next 19 years as well, which is nearly double the current consensus expectations. This expectation seems overly optimistic given OMCL’s NOPAT and margin decline over the past few years.
Even if we assume OMCL can earn 5% NOPAT margins (highest since 2015) and grow NOPAT by 29% compounded annually, the stock is worth just $28/share today – a 36% downside. This scenario assumes OMCL can grow revenue by consensus expectations (10%) compounded annually over the next decade. The rapid NOPAT growth can be attributed to the significant increase in NOPAT margins.
Auditable Impact of Footnotes and Forensic Accounting Adjustments
Our Robo-Analyst technology enables us to perform forensic accounting with scale and provide the research needed to fulfill fiduciary duties. In order to derive the true recurring cash flows, an accurate invested capital, and an accurate shareholder value, we made the following adjustments to Omnicell’s 2017 10-K:
Income Statement: we made $42 million of adjustments, with a net effect of removing $13 million in non-operating income (2% of revenue). We removed $27 million in non-operating income and $15 million in non-operating expenses. You can see all the adjustments made to OMCL’s income statement here.
Balance Sheet: we made $130 million of adjustments to calculate invested capital with a net increase of $64 million. One of the largest adjustments was $66 million due to off-balance sheet operating leases. This adjustment represented 9% of reported net assets. You can see all the adjustments made to OMCL’s balance sheet here.
Valuation: we made $334 million of adjustments with a net effect of decreasing shareholder value by $334 million. There were no adjustments that increased shareholder value. Apart from $280 million in total debt, which includes the operating leases noted above, the largest adjustment to shareholder value was $35 million in outstanding employee stock options. This adjustment represents 2% of OMCL’s market cap.
This article originally published on March 15, 2018.
Disclosure: David Trainer and Kyle Guske II receive no compensation to write about any specific stock, style, or theme.
Follow us on Twitter, Facebook, LinkedIn, and StockTwits for real-time alerts on all our research.
[1] Harvard Business School features the powerful impact of our research automation technology in the case New Constructs: Disrupting Fundamental Analysis with Robo-Analysts.
[2] Ernst & Young’s recent white paper “Getting ROIC Right” proves the superiority of our holdings research and analytics.
Click here to download a PDF of this report.
Photo Credit: Evan Leeson (Flickr)