Recap from August’s Picks
Our Most Attractive Stocks (-0.3%) underperformed the S&P 500 (+2.5%) last month. The best performing Most Attractive large cap stock gained 8% and the best performing Most Attractive small cap stock was up 20%. Overall, 16 out of the 40 Most Attractive stocks outperformed the S&P 500 in August, and 23 stocks had positive returns.
Our Most Dangerous Stocks (+2.1%) outperformed the S&P 500 (+2.5%) as a short portfolio last month. The best performing Most Dangerous large cap stock fell by 36% and the best performing Most Dangerous small cap stock fell by 25%. Overall, 21 out of the 40 Most Dangerous stocks outperformed the S&P 500 as shorts in August.
The successes of these model portfolios highlight the value of our machine learning and AI Robo-Analyst technology[1], which helps clients fulfill the fiduciary duty of care and make smarter investments[2].
17 new stocks make our Most Attractive list this month and 20 new stocks fall onto the Most Dangerous list this month. September’s Most Attractive and Most Dangerous stocks were made available to members on September 6, 2018.
Our Most Attractive stocks have high and rising returns on invested capital (ROIC) and low price to economic book value ratios. Most Dangerous stocks have misleading earnings and long growth appreciation periods implied by their market valuations.
Most Attractive Stocks Feature for September: PetMed Express (PETS: $34/share)
PetMed Express (PETS), online pet pharmacy, is the featured stock from September’s Most Attractive Stocks Model Portfolio. PETS was a featured Long Idea in June 2018, and remains Very Attractive.
Since 2012, PETS has grown revenue by 2% compounded annually while after-tax profit (NOPAT) has grown by 13% compounded annually, per Figure 1. The company’s NOPAT margin has increased from 7% in 2012 to 12% over the trailing twelve months (TTM) and its return on invested capital (ROIC) has improved from an already impressive 43% in 2012 to 79% TTM.
Figure 1: PETS’ Revenue & NOPAT Since 2012
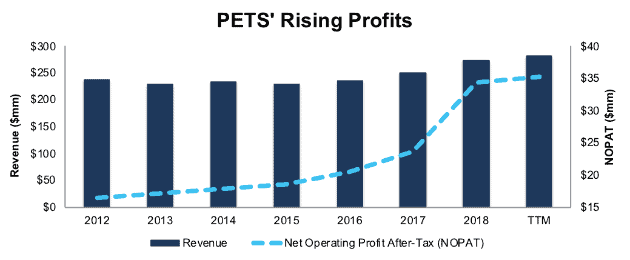
Sources: New Constructs, LLC and company filings
PETS Valuation Provides Upside
At its current price of $34/share, PETS has a price-to-economic book value (PEBV) ratio of 1.0. This ratio means the market expects PETS’ NOPAT will never grow past its current levels. Such an expectation seems pessimistic for a firm that has grown NOPAT by 13% compounded annually since 2012 and 26% compounded annually since 2002.
If PETS can maintain its current NOPAT margin (12%) and grow NOPAT by just 6% compounded annually for the next decade, the stock is worth $50/share today – a 47% upside. See the math behind this dynamic DCF scenario.
Critical Details Found in Financial Filings by Our Robo-Analyst Technology
As investors focus more on fundamental research, research automation technology is needed to analyze all the critical financial details in financial filings. Below are specifics on the adjustments we make based on Robo-Analyst findings in PetMed Express’ 2018 10-K:
Income Statement: we made $4 million of adjustments, with a net effect of removing $3 million in non-operating income (1% of revenue). You can see all the adjustments made to PETS’ income statement here.
Balance Sheet: we made $67 million of adjustments to calculate invested capital with a net decrease of $66 million. One of the largest adjustments was $64 million due to excess cash. This adjustment represented 55% of reported net assets. You can see all the adjustments made to PETS’ balance sheet here.
Valuation: we made $81 million of adjustments with a net effect of increasing shareholder value by $80 million. Apart from the excess cash noted above, the largest adjustment to shareholder value was $1 million in deferred tax liability. This adjustment represents <1% of PETS’ market cap.
Most Dangerous Stocks Feature: IQVIA Holdings Inc. (IQV: $128/share)
IQVIA Holdings (IQV), a healthcare data analysis and clinical trial research provider, is the featured stock from September’s Most Dangerous Stocks Model Portfolio. IQV was also a Danger Zone pick in May 2018 and featured in July 2018.
In 2016, IQV acquired IMS Health, which provides data and technology to the healthcare industry, and changed its name to IQVIA. The company, which had just $1.9 billion in invested capital prior to the acquisition, paid over $17.5 billion, a 1,000% increase in invested capital, when factoring in the debt it took on as part of the deal.
The problem here is simple. The firm overpaid by a lot: $17.5 billion for $192 million in annual NOPAT, an ROIC of just 1%. Per Figure 2, IQVIA’s economic earnings – the real cash flows of the business, which account for the cost of capital – have been negative since the acquisition.
Figure 2: IQVIA’s Misleading Earnings

Sources: New Constructs, LLC and company filings
IQV Provides Poor Risk/Reward
At IQV’s current price of $128/share, the market’s expectations for profit growth look overly optimistic. To justify its current price, IQV must immediately raise its NOPAT margin to 11% (compared to 7% TTM) and grow NOPAT by 15% compounded annually for the next nine years. See the math behind this dynamic DCF scenario.
Even if company can achieve a 9% NOPAT margin (regaining the pre-tax margins of 12% it earned in 2015-2016 and benefiting from a reduction of its tax rate to 24%) and grow NOPAT by 10% compounded annually over the next decade, the stock is worth $62/share today – a 48% downside. See the math behind this dynamic DCF scenario.
Critical Details Found in Financial Filings by Our Robo-Analyst Technology
As investors focus more on fundamental research, research automation technology is needed to analyze all the critical financial details in financial filings. Below are specifics on the adjustments we make based on Robo-Analyst findings in IQVIA Holdings’ 2017 10-K:
Income Statement: we made $2 billion of adjustments, with a net effect of removing $655 million in non-operating income (7% of revenue). You can see all the adjustments made to IQV’s income statement here.
Balance Sheet: we made $2.5 billion of adjustments to calculate invested capital with a net increase of $514 million. One of the largest adjustments was $629 million due to operating leases. This adjustment represented 3% of reported net assets. You can see all the adjustments made to IQV’s balance sheet here.
Valuation: we made $13.3 billion of adjustments with a net effect of decreasing shareholder value by $12.5 billion. Apart from $11.4 billion in total debt, which includes the $629 million in operating leases noted above, the largest adjustment to shareholder value was $705 million in deferred tax liabilities. This adjustment represents 3% of IQV’s market cap.
This article originally published on September 11, 2018.
Disclosure: David Trainer and Kyle Guske II receive no compensation to write about any specific stock, style, or theme.
Follow us on Twitter, Facebook, LinkedIn, and StockTwits for real-time alerts on all our research.
[1] Harvard Business School features the powerful impact of our research automation technology in the case New Constructs: Disrupting Fundamental Analysis with Robo-Analysts.
[2] Ernst & Young’s recent white paper “Getting ROIC Right” proves the superiority of our holdings research and analytics.