Recap from August’s Picks
Our Most Attractive Stocks (-3.6%) underperformed the S&P 500 (-0.6%) last month. Most Attractive Large Cap stock Gentex Corporation (GNTX) gained 6%. Most Attractive Small Cap stock Medifast Inc. (MED) was up 32%. Overall, 13 out of the 40 Most Attractive stocks outperformed the S&P 500 in August.
Our Most Dangerous Stocks (-2.0%) outperformed the S&P 500 (-0.6%) as a short portfolio last month. Most Dangerous Large Cap stock Mallinckrodt, Plc (MNK) and Most Dangerous Small Cap Stock OFG Bancorp (OFG) each fell by 13%. Overall, 22 out of the 40 Most Dangerous stocks outperformed the S&P 500 as short positions in August.
The successes of the Most Attractive and Most Dangerous stocks highlight the value of our Robo-Analyst technology, which helps clients fulfill the fiduciary duty of care when making investment recommendations.
21 new stocks make our Most Attractive list this month and 19 new stocks fall onto the Most Dangerous list this month. September’s Most Attractive and Most Dangerous stocks were made available to members on September 7, 2017.
Our Most Attractive stocks have high and rising returns on invested capital (ROIC) and low price to economic book value ratios. Most Dangerous stocks have misleading earnings and long growth appreciation periods implied by their market valuations.
Most Attractive Stocks Feature for September: Discover Financial Systems (DFS: $58/share)
Discover Financial Services (DFS), a payment services and credit card provider, is one of the additions to our Most Attractive stocks for September. DFS was also a featured Long Idea in December 2014 and highlighted as an underappreciated stock in July 2017.
Since 2011, DFS has grown revenue by 5% compounded annually. Over the same time, the company has grown after-tax profit (NOPAT) by 57% compounded annually, per Figure 1. The impressive NOPAT growth can be credited to margin improvement from 3% in 2010 to 29% over the last twelve months. DFS also earns a top-quintile 19% return on invested capital (ROIC).
Figure 1: Discover’s NOPAT Growth Since 2010
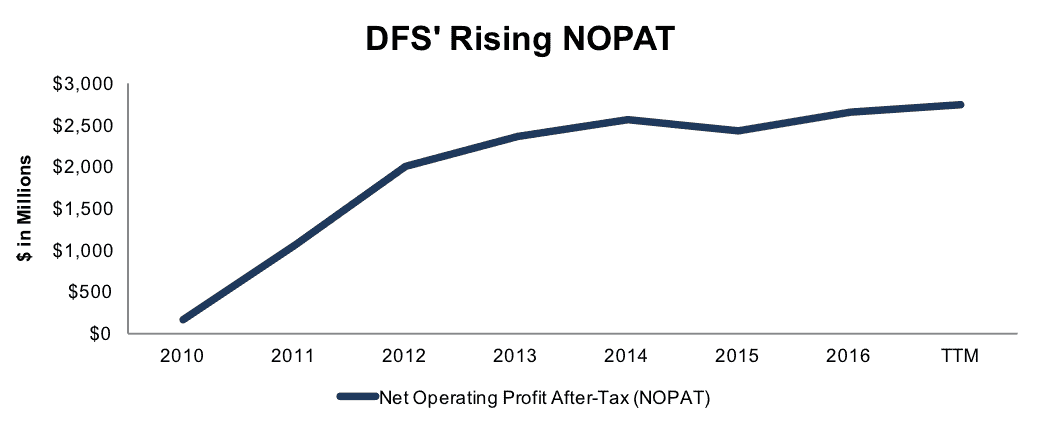
Sources: New Constructs, LLC and company filings
DFS Presents an Attractive Risk/Reward Trade-Off
DFS is down 19% year-to-date while the S&P 500 is up 11%. This price depreciation amidst solid fundamentals provides an attractive buying opportunity. At its current price of $58/share, DFS has a price-to-economic book value (PEBV) ratio of 0.6. This ratio means the market expects DFS’ NOPAT to permanently decline 40% from current levels. This expectation seems rather pessimistic for a firm that has consistently grown NOPAT over the past decade.
If DFS were to never grow after-tax profits from current levels, the economic book value, or no growth value of the firm, is $101/share – a 74% upside. If DFS maintains TTM NOPAT margins (29%) and can grow NOPAT by 4% for the next decade, the stock is worth $125/share today – a 115% upside.
Auditable Impact of Footnotes & Forensic Accounting Adjustments
In order to derive the true recurring cash flows, an accurate invested capital, and an accurate shareholder value, we made the following adjustments to Discover’s 2016 10-K:
Income Statement: we made $477 million of adjustments, with a net effect of removing $323 million in non-operating expenses (4% of revenue). We removed $68 in non-operating income and $391 in non-operating expenses. You can see all the adjustments made to DFS’ income statement here.
Balance Sheet: we made $3 billion of adjustments to calculate invested capital with a net increase of $2.7 billion. One of the largest adjustments was $2.2 billion due to total reserves. This adjustment represented 19% of reported net assets. You can see all the adjustments made to DFS’ balance sheet here.
Valuation: we made $786 million of adjustments with a net effect of decreasing shareholder value by $786 million. There were no adjustments that increased shareholder value. The largest adjustment to shareholder value was $560 million in preferred stock. This adjustment represents 3% of DFS’ market cap. Despite the decrease in shareholder value, DFS remains undervalued.
Most Dangerous Stocks Feature: New York Times Company (NYT: $19/share)
New York Times Company (NYT), an iconic newspaper and content publisher, is one of the additions to our Most Dangerous stocks for September.
Over the past decade, NYT’s revenue has fallen by 7% compounded annually. Over the same time, the company’s NOPAT has fallen by 9% compounded annually, per Figure 2. Along with the decline in profits, NYT’s ROIC has fallen from 5% in 2006 to a bottom-quintile 3% TTM.
Figure 2: New York Time’s NOPAT Over the Past Decade
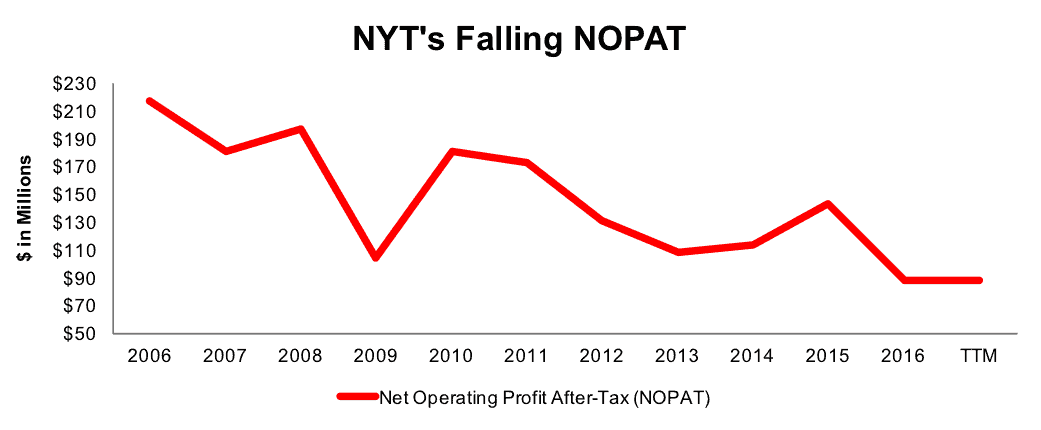
Sources: New Constructs, LLC and company filings
NYT Presents Valuation Risk
Despite the lagging fundamentals, NYT is up 42% year-to-date, which far outpaces the 11% gain of the S&P 500. The significant price appreciation leaves NYT with significant downside risk.
To justify its current price of $19/share, NYT must maintain 2016 NOPAT margins (6%) and grow NOPAT by 8% compounded annually for the next 13 years. This expectation seems rather optimistic for a firm that has seen NOPAT decline by 9% compounded annually over the past decade.
Even if NYT is able to maintain 2016 margins and grow NOPAT by just 4% compounded annually for the next decade, the stock is only worth $12/share today – a 37% downside.
Auditable Impact of Footnotes & Forensic Accounting Adjustments
In order to derive the true recurring cash flows, an accurate invested capital, and an accurate shareholder value, we made the following adjustments to New York Time Company’s 2016 10-K:
Income Statement: we made $367 million of adjustments, with a net effect of removing $59 million in non-operating expenses (4%of revenue). We removed $154 million in non-operating income and $213 million in non-operating expenses. You can see all the adjustments made to NYT’s income statement here.
Balance Sheet: we made $3.2 billion of adjustments to calculate invested capital with a net increase of $1.2 billion. One of the largest adjustments was $1.3 billion due to asset write-downs. This adjustment represented 72% of reported net assets. You can see all the adjustments made to NYT’s balance sheet here.
Valuation: we made $1.6 billion of adjustments with a net effect of decreasing shareholder value by $63 million. The largest adjustment to shareholder value was $527 million in underfunded pensions. This adjustment represents 17% of NYT’s market cap.
This article originally published on September 12, 2017.
Disclosure: David Trainer, Kyle Guske II, and Kenneth James receive no compensation to write about any specific stock, style, or theme.
Follow us on Twitter, Facebook, LinkedIn, and StockTwits for real-time alerts on all our research.