
Recap from July’s Picks
Our Most Attractive Stocks (+0.0%) underperformed the S&P 500 (+2.1%) last month. Most Attractive Large Cap stock O’Reilly Automotive (ORLY) gained 20%. Most Attractive Small Cap stock Kulicke & Soffa Industries (KLIC) was up 9%. Overall, 13 out of the 40 Most Attractive stocks outperformed the S&P 500 in August and 22 stocks had positive returns.
Our Most Dangerous Stocks (-0.7%) outperformed the S&P 500 (+2.1%) as a short portfolio last month. Most Dangerous Large Cap stock Vornado Realty Trust (VNO) fell by 15% and Most Dangerous Small Cap Stock LSB Industries (LXU) fell by 34%. Overall, 26 out of the 40 Most Dangerous stocks outperformed the S&P 500 as short positions in August.
The successes of the Most Attractive and Most Dangerous stocks highlight the value of our Robo-Analyst technology, which helps clients fulfill the fiduciary duty of care when making investment recommendations.
13 new stocks make our Most Attractive list this month and 10 new stocks fall onto our Most Dangerous list this month. August’s Most Attractive and Most Dangerous stocks were made available to members on August 3, 2017.
Our Most Attractive stocks have high and rising returns on invested capital (ROIC) and low price to economic book value ratios. Most Dangerous stocks have misleading earnings and long growth appreciation periods implied by their market valuations.
Most Attractive Stocks Feature for August: PepsiCo Inc. (PEP: $117/share)
PepsiCo Inc. (PEP), a global food and beverage company, is one of the additions to our Most Attractive stocks for August. PEP was also an addition to July’s Dividend Growth Stocks Model Portfolio.
PepsiCo has grown NOPAT by 9% compounded annually since 2000, per Figure 1. NOPAT growth has been greater than revenue growth because of PepsiCo’s improving NOPAT margin, which has risen from 11% in 2012 to 13% over the last twelve months (TTM).
Figure 1: PepsiCo’s NOPAT Growth Since 2000
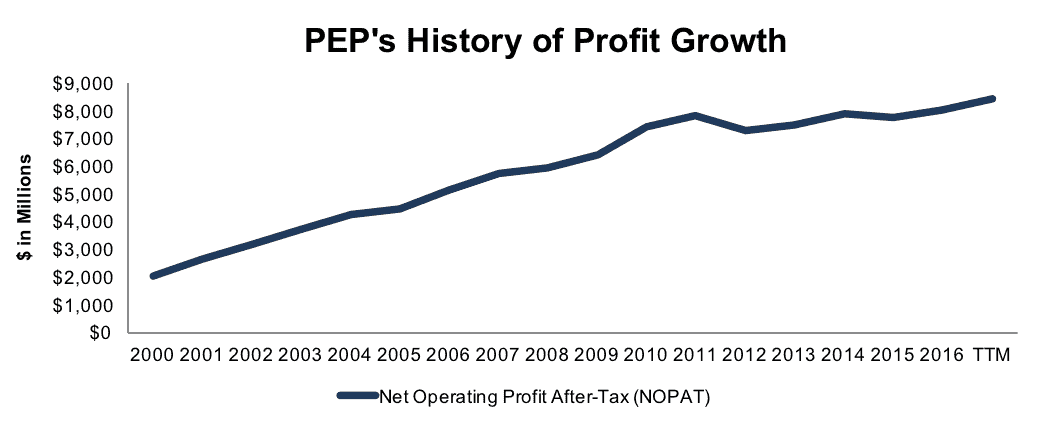
Sources: New Constructs, LLC and company filings
PEP’s return on invested capital (ROIC) has improved from 9% in 2012 to 11% TTM. In addition, PEP has generated $43 billion (26% of market cap) in free cash flow (FCF) over the past five years, which far exceeds $20 billion of dividends paid over the same period.
Low Expectations Embedded in Stock Price
The market has rewarded PEP for its consistent profit growth with a 59% gain over the past five years. PEP has lagged the S&P 500 (+75%), however, and continues to present an attractive risk/reward trade-off despite the price increase. At its current price of $117/share, PEP has a price-to-economic book value (PEBV) ratio of 1.0. this ratio means the market expects PEP’s NOPAT to never grow from current levels. This expectation seems rather pessimistic given PEP’s nearly two decades of consistent NOPAT growth.
If PEP can maintain 2016 NOPAT margins (13%) and grow NOPAT by just 3% compounded annually for the next decade, the stock is worth $148/share today – a 26% upside.
Impacts of Footnotes Adjustments and Forensic Accounting
In order to derive the true recurring cash flows, an accurate invested capital, and an accurate shareholder value, we made the following adjustments to PepsiCo’s 2016 10-K:
Income Statement: we made $4.6 billion of adjustments, with a net effect of removing $1.7 billion in non-operating expense (3% of revenue). We removed $1.5 billion in non-operating income and $3.1 billion in non-operating expenses. You can see all the adjustments made to PEP’s income statement here.
Balance Sheet: we made $55.7 billion of adjustments to calculate invested capital with a net increase of $22.4 billion. One of the largest adjustments was $14.2 billion due to other comprehensive income. This adjustment represented 27% of reported net assets. You can see all the adjustments made to PEP’s balance sheet here.
Valuation: we made $63 billion of adjustments with a net effect of decreasing shareholder value by $35 billion. The largest adjustment to shareholder value was $41 billion in total debt, which includes $1.5 billion in operating leases. This lease adjustments represents <1% of PEP’s market cap. Despite the decrease in shareholder value, PEP remains undervalued.
Most Dangerous Stocks Feature: Emmis Communications (EMMS: $3/share)
Emmis Communications, a radio broadcaster, is one of the additions to our Most Dangerous stocks for August.
Since 2006, EMMS’ revenue has fallen 5% compounded annually. Per Figure 2, NOPAT has fallen by 10% compounded annually, to $16 million in 2016, and even further to $13 million TTM. NOPAT margin has fallen from 12% in 2006 to 7% TTM. Emmis’ ROIC has also declined from an already low 2% in 2006 to a bottom-quintile 1% TTM.
Figure 2: Emmis Communication’s NOPAT Decline Since 2006
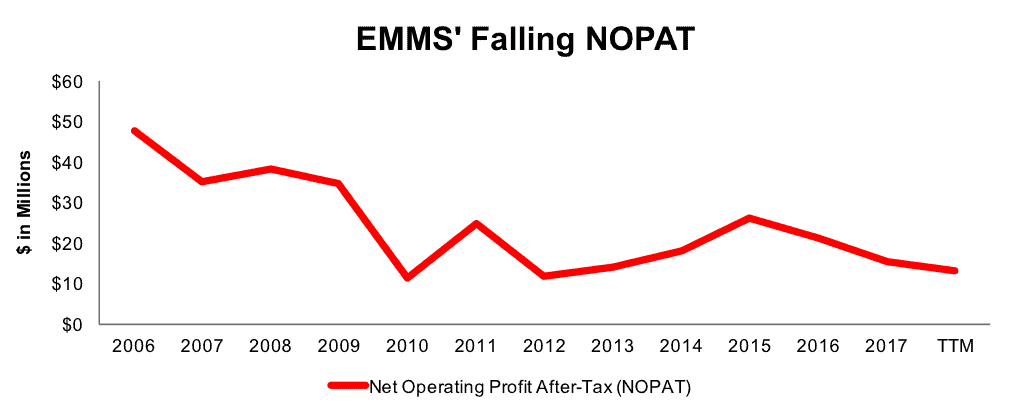
Sources: New Constructs, LLC and company filings
EMMS Remains Overvalued
Investors have recognized EMMS’ struggles and the stock is down 27% over the past year. However, despite the decline, shares still have significant downside risk.
To justify its current price of $3/share, EMMS must maintain TTM NOPAT margins (7%) and grow NOPAT by 8% compounded annually for the next 14 years. Such a scenario seems rather optimistic given EMMS’ falling revenues, margins, and NOPAT over the past decade.
Even if EMMS is able to maintain 2016 NOPAT margins and grow NOPAT by 6% compounded annually for the next decade, the stock has no value. Without significant changes to the business, EMMS investors face large downside risk and a poor risk/reward trade-off.
Each of these scenarios also assumes EMMS is able to grow revenue and NOPAT/FCF without increasing working capital or investing in fixed assets. This assumption is unlikely but allows us to create scenarios that demonstrate how high expectations embedded in the current valuation truly are. For reference, EMMS’ invested capital has grown by an average of $9 million (4% of revenue) per year over the past five years.
Impacts of Footnotes Adjustments and Forensic Accounting
In order to derive the true recurring cash flows, an accurate invested capital, and an accurate shareholder value, we made the following adjustments to Emmis Communication’s 2017 10-K:
Income Statement: we made $63 million of adjustments, with a net effect of removing $3 million in non-operating expense (1% of revenue). We removed $30 million in non-operating income and $33 million in non-operating expenses. You can see all the adjustments made to EMMS’ income statement here.
Balance Sheet: we made $1.2 billion of adjustments to calculate invested capital with a net increase of $1.1 billion. One of the largest adjustments was $1 billion due to asset write-downs. This adjustment represented 456% of reported net assets. You can see all the adjustments made to EMMS’ balance sheet here.
Valuation: we made $342 million of adjustments with a net effect of decreasing shareholder value by $342 million. There were no adjustments that increased shareholder value. One of the largest adjustments to shareholder value was $46 million in operating leases. This adjustment represents 136% of EMMS’ market cap.
This article originally published on August 9, 2017.
Disclosure: David Trainer, Kyle Guske II, and Kenneth James receive no compensation to write about any specific stock, style, or theme.
Follow us on Twitter, Facebook, LinkedIn, and StockTwits for real-time alerts on all our research.