Nine new stocks make our Safest Dividend Yield Model Portfolio this month, which was made available to members on August 24, 2017.
Recap from July’s Picks
Our Safest Dividend Yield Model Portfolio underperformed the S&P 500 last month. The Model Portfolio fell 2.6% on a price return basis and fell 2.4% on a total return basis. The S&P 500 fell 0.6% on a price return basis and total return basis. The best performing stocks in the portfolio were large cap stock GameStop Corporation (GME), which was up 4%, and small cap stock, TransAct Technologies (TACT), which was up 16%. Overall, 10 out of the 20 Safest Dividend Yield stocks outperformed the S&P in July.
Since inception, this Model Portfolio is up 9% on a price return basis (S&P +13) and 13% on a total return basis (S&P +15%).
This Model Portfolio highlights the value of our Robo-Analyst technology, which scales our forensic accounting expertise (featured in Barron’s) across thousands of stocks.
This Model Portfolio only includes stocks that earn an Attractive or Very Attractive rating, have positive free cash flow and economic earnings, and offer a dividend yield greater than 3%. Companies with strong free cash flow provide higher quality and safer dividend yields because we know they have the cash to support the dividend. We think this portfolio provides a uniquely well-screened group of stocks that can help clients outperform.
New Stock Feature for August: General Mills, Inc. (GIS: $54/share)
General Mills (GIS), a producer of consumer foods such as cereals and snacks, is one of the additions to our Safest Dividend Yield Model Portfolio in August.
Over the past decade, GIS has grown revenue by 2% compounded annually. Per Figure 1, after-tax profit (NOPAT) has grown 3% compounded annually over the same period. The firm’s ability to grow NOPAT faster than revenue can be credited to margin improvement. NOPAT margin has increased from 12% in 2007 to 13% in 2017. Return on invested capital (ROIC) has also been impressively consistent. Since 2007, GIS has averaged a 9% ROIC with a high of 11% and a low of 8%.
Add in the 3.6% dividend yield and it’s easy to see why GIS earned a spot on this month’s Model Portfolio.
Figure 1: GIS NOPAT Growth Since 2007
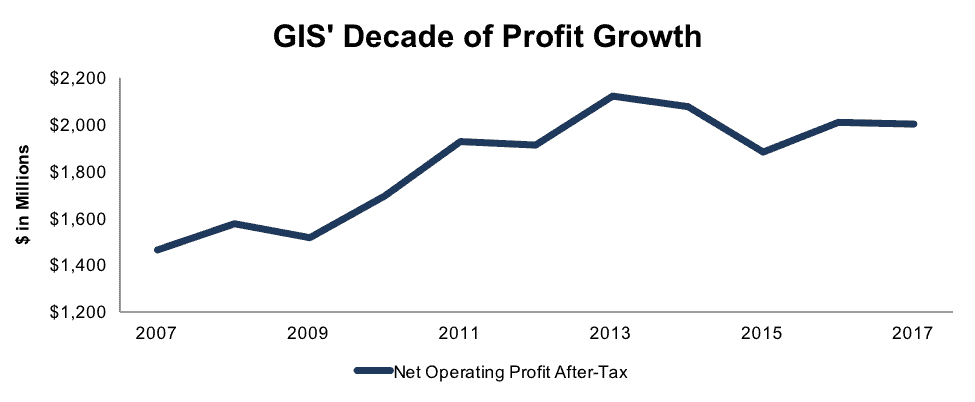
Sources: New Constructs, LLC and company filings
Free Cash Flow Supports Dividend Growth
GIS has increased its quarterly dividend from $0.38 to $0.49 over the past five years, or 7% compounded annually. Dividend growth has been made possible by GIS’ strong free cash flow. Per Figure 2, GIS has generated cumulative FCF of $9.2 billion (29% of market cap) and paid out cumulative dividends of $5.1 billion since 2013. GIS’ 2017 FCF of nearly $2 billion equates to a 4% FCF yield compared to 3% for the average S&P 500 stock.
Companies with strong free cash flow provide higher quality dividend yields because we know the firm has the cash to support its dividend. On the flip side, dividends from companies with low or negative free cash flow cannot be trusted as much because the company may not be able to sustain paying dividends.
Figure 2: General Mills’ FCF vs. Dividend Since 2013
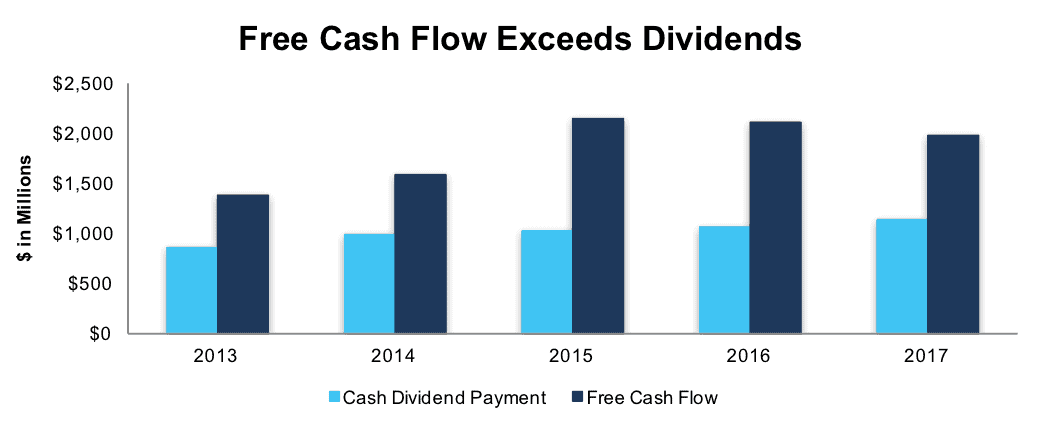
Sources: New Constructs, LLC and company filings
GIS Remains Undervalued
GIS is down 12% year-to-date, while the S&P 500 is up 9%. This price depreciation amidst solid fundamentals provides an attractive buying opportunity. At its current price of $54/share, GIS has a price-to-economic book value (PEBV) of 1.0. This ratio means the market expects GIS’ NOPAT to never grow from current levels. This expectation seems rather pessimistic for a firm with a long track record of NOPAT growth.
If GIS can maintain 2017 NOPAT margins (13%) and grow NOPAT by just 2% compounded annually for the next decade, the stock is worth $71/share today – a 31% upside from the current valuation. Significant upside potential coupled with GIS’ 3.6% dividend yield provide investors with an attractive risk/reward opportunity.
Impacts of Footnotes Adjustments and Forensic Accounting
Our Robo-Analyst technology enables us to perform forensic accounting with scale and provide the research needed to fulfill fiduciary duties. In order to derive the true recurring cash flows, an accurate invested capital, and a real shareholder value, we made the following adjustments to General Mills’ 2017 10-K:
Income Statement: we made $1.8 billion of adjustments with a net effect of removing $348 million in non-operating expense (2% of revenue). We removed $1.1 billion related to non-operating expenses and $746 million related to non-operating income. See all adjustments made to GIS’ income statement here.
Balance Sheet: we made $5.7 billion of adjustments to calculate invested capital with a net increase of $5.6 billion. The most notable adjustment was $2.3 billion (14% of reported net assets) related to other comprehensive income. See all adjustments to GIS’ balance sheet here.
Valuation: we made $14.4 billion of adjustments with a net effect of decreasing shareholder value by $14.4 billion. Apart from $10.2 billion in total debt, which includes $428 million in off-balance sheet operating leases, the largest adjustment to shareholder value was $1.7 billion in deferred tax liabilities. This tax adjustment represents 5% of GIS’ market value. Despite the decrease in shareholder value, GIS remains undervalued.
This article originally published here on August 29, 2017.
Disclosure: David Trainer, Kyle Guske II, and Kenneth James receive no compensation to write about any specific stock, style, or theme.
Follow us on Twitter, Facebook, LinkedIn, and StockTwits for real-time alerts on all our research.