
We closed MCD on April 20, 2023. A copy of the associated Position Close report is here.
“It’s difficult to make predictions, especially about the future.”
This quote has been repeated so many times that no one quite knows who said it first. Perhaps it was baseball player Yogi Berra. Or humorist Mark Twain. Or Danish physicist Niels Bohr.
The point is, this quote has become a part of our cultural fabric, and it has done so because it expresses a simple and fundamental truth. Accurately forecasting what’s going to happen in the future is incredibly difficult, almost impossible.
Few areas illustrate this difficulty more profoundly than financial markets, where analyst projections of earnings are regularly off by 10+%. Sometimes, even the most well-recognized experts make shockingly bad predictions. No one truly knows (legally) what the market is going to do next, and the risk involved in that uncertainty is what creates the potential for significant returns.
The Alternative To Making Predictions
Of course, those returns are only available to those that participate in the stock market, and participating in the market implies some sort of prediction about the future. Even if you just buy a broad-based index fund, you’re predicting the broader market will go up. Otherwise, why make that (or any) investment?
However, there’s a better way to invest. Instead of making your own prediction about the future, you can analyze the market’s prediction by quantifying the cash flow expectations baked into the market’s valuation of a stock. Then, you can make a more objective judgment about whether or not those expectations are realistic.
This method, termed “Expectations Investing” by Alfred Rappaport and Michael Mauboussin in their book of the same name, can be incredibly effective. It’s effective because it removes the need to make precise predictions about the future. By quantifying market expectations across thousands of stock as we do, it’s easy to find pockets of irrationality and identify companies that are over or undervalued.
How To Quantify Market Expectations
Our primary approach to quantifying market expectations is application of our reverse discounted cash (DCF) flow model. The right way to use DCF models is not try to predict the future, but to quantify the future that the stock price is predicting. We will explain in detail more here, and you can get numerous real-world examples of how we use our reverse DCF to help investors determine when to buy or sell in all of our Danger Zone and Long Idea reports.
Another approach is to calculate a company’s economic book value, or the no-growth value of the business based on the perpetuity value of its current cash flows. This value can be calculated by dividing a company’s LTM after-tax profit (NOPAT) by its weighted average cost of capital (WACC), and then adjusting for non-operating assets and liabilities.
Figure 1: Why We Recommended McDonald’s
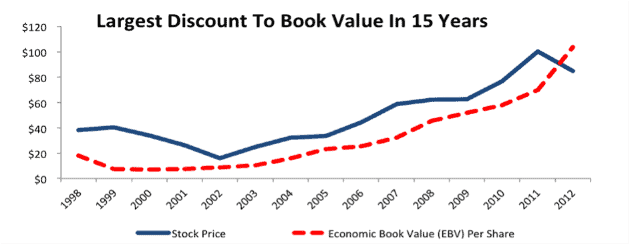
Sources: New Constructs, LLC and company filings.
The ratio of a company’s stock price to its economic book value per share (PEBV) sends a clear message about market expectations for the stock and can be a very powerful tool for investors. Figure 1 shows how PEBV influenced our decision to recommend McDonald’s (MCD) shares to investors in late 2012.
Shares at that time were trading at a PEBV of 0.82, an unprecedented discount for a company with MCD’s track record of growth and profitability. The market’s valuation suggested that MCD’s NOPAT would permanently decline 18% and never recover. Those expectations seemed overly pessimistic to us.
As it turned out, MCD did end up struggling significantly after our call. Increased competition from fast casual restaurants like Chipotle (CMG) and Panera (PNRA) that appealed to health-conscious diners compressed MCD’s margins and sent its sales slumping.
Despite its struggles, however, things never got quite as bad for MCD as the market predicted. Between 2012 and 2015, NOPAT fell by only 16%, not the 18% projected by the stock price, and recent signs of a recovery have sent shares soaring to all-time highs. Figure 2 shows how MCD has delivered significant returns to investors since we made our prediction despite lackluster financial results.
Figure 2: Disappointing Profits No Obstacle To Shareholder Returns
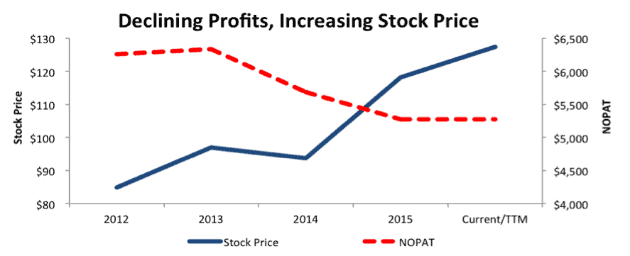
Sources: New Constructs, LLC and company filings.
Though MCD’s poor results caused it to miss out on the bull run of 2013-2014, its surge over the past twelve months has it at a 51% gain since our initial call, outperforming the S&P 500 (SPY) on a capital gains basis while also yielding a higher dividend.
We didn’t know exactly how McDonald’s was going to perform when we made the prediction in 2012. We simply knew that the expectations baked into the market’s valuation were so pessimistic that even if the company’s profits significantly declined, as they did, investors could still earn healthy returns.
Delayed Gratification
As Figure 2 shows, basing investment decisions off a quantification of market expectations doesn’t always deliver immediate results. In the case of MCD, it took nearly three years for our call to come to fruition. Short-term sector trends and market forces can allow a company to stay valued at irrational levels for quite some time especially when we know that very few people practice Expectations Investing these days.
Roughly three years ago, we warned investors to stay away from Williams Companies (WMB), calling it an example of the “sector trap.” Analysts excited about the company’s exposure to the rapidly growing natural gas sector were pumping up the stock, ignoring its low and declining return on invested capital (ROIC), significant write-downs indicating poor capital allocation, and the high expectations implied by its stock price.
Specifically, our discounted cash flow model showed that the company would need to grow NOPAT by 13% compounded annually for 15 years to justify its price at the time of ~$37/share. Those expectations seemed to be clearly unrealistic given the company’s 7% compounded annual NOPAT growth over the previous decade and a half.
For a time, WMB continued to gain in value despite the disconnect between its current cash flows and the cash flows implied by the stock’s valuation. As recently as mid-2015, the stock was up nearly 60% from our original call. However, as Figure 3 shows, WMB crashed hard when the market turned more volatile. It now has fallen nearly 60% from our original call, and it has significantly underperformed the S&P 500, the S&P Energy ETF (XEP), and peers Spectra Energy (SEP) and Enterprise Products Partners (EPD).
Figure 3: Short-Term Gains, Long-Term Declines
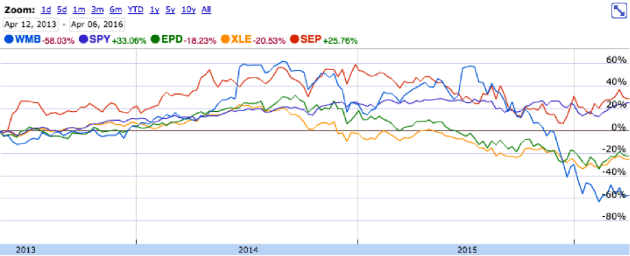
Source: Google Finance
Stocks with overly high expectations embedded in their prices can still perform well in the short-term, but they tend to face a reckoning eventually.
Stocks Due For A Correction
Roughly a year ago, we put engine manufacturer Briggs & Stratton (BGG) in the Danger Zone. Back then we argued that BGG’s history of value-destroying acquisitions, significant write-downs, and declining profits made it unlikely that the company would hit the high expectations set by the market.
Specifically, our model showed that the company needed to grow NOPAT by 10% compounded annually for 17 years to justify its price at the time of ~$20/share.
BGG actually did manage to meet this goal in year 1, growing NOPAT by 14% in 2015. However, we think this growth rate is unsustainable, as the company’s ROIC remains mired below 5%. Moreover, the company keeps spending money it doesn’t have on acquisitions, dividends, and buybacks, so it now sits with almost no excess cash and $660 million (68% of market cap) in combined debt and underfunded pension liabilities.
Despite the balance sheet concerns, the market only seemed to pay attention to the GAAP earnings growth, and BGG is up 13.8% since our call. At its new price of ~$23/share, the market expects 10% compounded annual NOPAT growth for the next 11 years. Despite one good year in 2015, there’s no reason to suspect that level of growth is sustainable for BGG. High market expectations mean this stock should drop hard the moment growth slows down.
On the other side of the coin, we still believe last year’s long pick Fluor Corporation (FLR) has significant upside. Despite slumping commodities prices affecting its oil, gas, and mining businesses, FLR still managed a 21% ROIC in 2015 and finished the year with a larger backlog than it had at the end of 2014. Investors only saw the downside though, and they sent FLR down 11%
Due to this decline, the market continues to assign FLR a low PEBV of 0.9, just as it did last March when we made our original call. Given the recent rebound in commodities, we don’t think a permanent 10% decline in NOPAT from these already low levels seems likely. Strong profitability and low market expectations lead us to believe an investment in FLR will pay off sooner or later.
Disclosure: David Trainer and Sam McBride receive no compensation to write about any specific stock, sector, style, or theme.
Click here to download a PDF of this report.
Photo Credit: lendingmemo.com (Flickr)