EVO Payments (EVOP: $15/share midpoint of IPO price range), a global merchant acquirer and payment processor, will IPO on Wednesday, May 23. At a price range of $14 to $16 per share, the company plans to raise ~$210 million and has an expected market cap of ~$1.2 billion. At the midpoint of its price range, EVOP currently earns our Unattractive rating.
While it may not attract as much attention as tech IPOs such as Snap (SNAP) or Spotify (SPOT), one could argue its more important, as it provides a key piece of the global commerce and transaction puzzle.
This report aims to help investors sort through EVO Payments’ financial filings to understand the fundamentals and valuation of this IPO.
NOPAT Reveals Falling GAAP Earnings are Misleading
EVOP earns revenues by charging acquirer fees on each transaction processed on its network. The company notes it processes more than 900 million transactions in North America and 1.7 billion transactions in Europe annually.
At first glance, EVOP had a rough 2017. GAAP net income declined from $48 million in 2016 to -$40 million in 2017. However, Figure 1 shows that after-tax operating profit (NOPAT) actually increased from $34 million to $40 million in 2017, or 29% year-over-year.
Figure 1: EVOP GAAP Net Income and NOPAT Since 2016
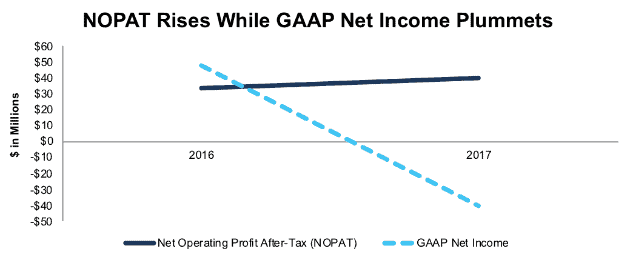
Sources: New Constructs, LLC and company filings
Non-operating items significantly overstated EVOP’s reported profitability in 2016 and when they were not present in 2017, EVOP’s profitability showed the large decline noted above. In 2016, EVOP’s reported profits included $72.4 million in proceeds from the sale of its membership interest in Visa Europe, which was included in Other Income on the income statement. We remove this non-operating income when calculating NOPAT to get at the true recurring profits of the business.
In 2017 the Robo-Analyst[1] uncovered other smaller non-operating expenses, such as:
- $1.7 million in asset-write downs
- $1.3 million in costs incurred in connection with an acquisition
With only two years of history, it’s hard to draw any firm conclusions about the long-term trend in profitability for EVOP, but our adjustments show that true profits increased in 2017 despite GAAP net income’s large decline.
EVOP is Overvalued Compared to Peers
Numerous case studies show that getting ROIC right[2] is an important part of making smart investments. Ernst & Young recently published a white paper that proves the material superiority of our forensic accounting research and measure of ROIC. The technology that enables this research is featured by Harvard Business School.
As Figure 2 shows, ROIC explains 60% of the difference in enterprise value per invested capital (a cleaner version of price to book) for the 66 Business Support Service companies we have under coverage.
Figure 2: ROIC vs. Enterprise Value/Invested Capital for EVOP
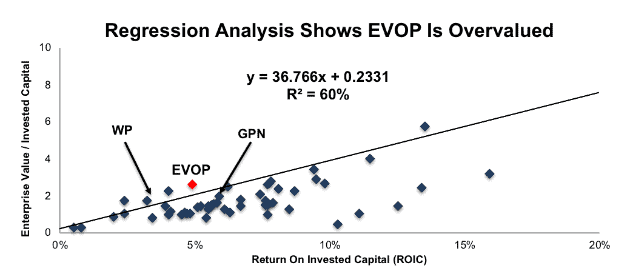
Sources: New Constructs, LLC and company filings
If EVOP were valued at the same level as its peers, it would be worth $9/share, 39% below the midpoint of the proposed offering range.
In other words, Figure 2 shows that at the proposed offering price, the market would be expecting EVOP’s ROIC to rise to 8%. The market expects the company’s profitability to improve after showing little movement in 2017.
Rising Costs and Low Margins Raise Red Flags
While EVOP’s NOPAT increased in 2017, its margins declined and raise a red flag about EVOP’s competitive advantage (or lack thereof) in its industry. Pre-tax operating margin (NOPBT) fell 30 basis points, from 10.4% in to 10.1% year-over-year. Despite posting an impressive 20% revenue growth rate in 2017, selling, general, and administrative expenses grew 27% YoY and cost of sales grew 17% YoY.
EVOP’s average invested capital turns, a measure of balance sheet efficiency, were unchanged YoY, and currently sit at 0.61. The combination of low margins and invested capital turns have led to EVOP earning only a 5% return on invested capital (ROIC), which ranks in the bottom 40% of all companies we cover.
When compared to peers, such as First Data Corp (FDC), Global Payments, Inc. (GPN), Total System Services (TSS), or Worldpay (WP), EVOP’s margins rank last and its ROIC only bests Worldpay. More details in Figure 3.
Figure 3: EVOP’s ROIC & Margins Vs. Peers
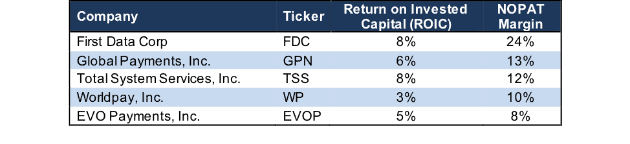
Sources: New Constructs, LLC and company filings
Multi Class Share Structure Means Investors Have Little Voting Power
EVO Payments plans to follow in the footsteps of Snapchat (SNAP), Dropbox (DBX), and Spotify (SPOT) by using multiple share classes that prevent public investors from having a real say in the governance of the company. Post-IPO, EVO Payments will have four separate share classes. Investors in this offering will own ~92-93% (depending upon underwriter exercise options) of outstanding Class A shares but hold just 25-27% of the voting power in the company.
Class B, C, and D shares are owned by Blueapple (a corporation controlled by entities affiliated with EVOP founder and Chairman of the Board, Rafik R. Sidhom), Madison Dearborn Partners, executive officers and current and former employees. Post-IPO, Blueapple, executive officers, and Madison Dearborn Partners and current/former employees will hold 16%, 15% and 42% of the voting power respectively. Each owner of Class B, C, and D shares have an exchange right to exchange shares for newly issues shares of Class A stock on a one-for-one basis.
This poor corporate governance, combined with a low ROIC and overvalued stock price, makes EVOP an IPO that investors should avoid.
Auditable Impact of Footnotes and Forensic Accounting Adjustments
Our Robo-Analyst technology enables us to perform forensic accounting with scale and provide the research needed to fulfill fiduciary duties. In order to derive the true recurring cash flows, an accurate invested capital, and an accurate shareholder value, we made the following adjustments to EVO Payments’ 2017 S-1:
Income Statement: we made $83 million of adjustments, with a net effect of removing $81 million in non-operating expense (16% of revenue). We removed $1 million in non-operating income and $82 million in non-operating expenses. You can see all the adjustments made to EVOP’s income statement here.
Balance Sheet: we made $472 million of adjustments to calculate invested capital with a net increase of $66 million. One of the largest adjustments was $68 million due to other comprehensive income. This adjustment represented 9% of reported net assets. You can see all the adjustments made to EVOP’s balance sheet here.
Valuation: we made $1.2 billion of adjustments with a net effect of decreasing shareholder value by $872 million. Apart from $898 million in total debt, which includes $34 million in operating leases, the largest adjustment to shareholder value was $152 million in minority interests. This minority interest adjustment represents 13% of EVOP’s proposed market cap.
This article originally published on May 22, 2018.
Disclosure: David Trainer, Kyle Guske II, and Sam McBride receive no compensation to write about any specific stock, style, or theme.
Follow us on Twitter, Facebook, LinkedIn, and StockTwits for real-time alerts on all our research.
[1] Harvard Business School features the powerful impact of research automation in the case New Constructs: Disrupting Fundamental Analysis with Robo-Analysts.
[2] Ernst & Young’s recent white paper “Getting ROIC Right” demonstrates the link between an accurate calculation of ROIC and shareholder value.