We closed this position on May 19, 2022. A copy of the associated Position Update report is here.
As a leading mortgage originator, can Rocket Companies’ (RKT: $21/share) tech-driven approach drive superior efficiency and higher margins? Or, is the company just another originator whose profits will rise and fall with interest rates?
The answers to these questions are key to assessing the valuation of this stock.
This report aims to help investors sort through Rocket Companies’ financial filings to understand the fundamentals and valuation of this recent IPO.
The Non-GAAP Story Paints a Rosier Picture
Unlike many IPOs in recent years, Rocket Companies is actually profitable and generates a high return on invested capital (ROIC). The firm has consistently grown its share of mortgage origination volume, surpassing Wells Fargo to become the largest U.S. mortgage lender by volume in 2018. In 2019, the firm had $145 billion in originations, and a market share of 9.2% in the three months ended March 31, 2020.
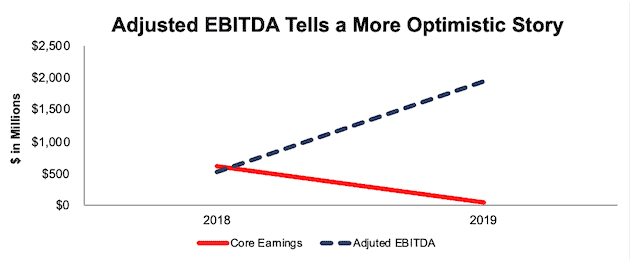
Despite its rapid top-line growth, the company’s core earnings[1] are trending in the wrong direction, falling from $613 million in 2018 to just $44 million in 2019. Core earnings provide a better measure of profitability and truer insights into valuation than other measures of profits from legacy data providers.
Rocket Companies’ non-GAAP metrics, such as adjusted EBITDA, mask falling core earnings (and GAAP net income). In 2019, adjusted EBITDA excluded $790 million in the change in fair value of mortgage servicing rights (MSRs), which are largely dependent upon interest rates and prepayment speeds, and $40 million in non-cash-based stock compensation expense.
Figure 1 shows that Rocket Companies’ Adjusted EBITDA is rising while core earnings are falling.
Figure 1: Core Earnings and Adjusted EBITDA for Rocket Companies: 2018-2019
Sources: New Constructs, LLC and company filings
Market Leader in a $2+ Trillion Market
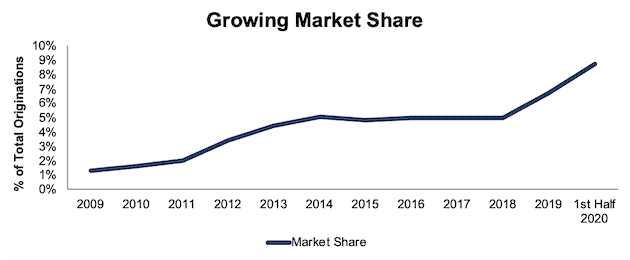
The mortgage origination market is large, with an estimated $2.2 trillion of origination volume in 2019, and highly fragmented, with the top 5 retail mortgage originators accounting for only 17% of the market in 2019. Such a fragmented market allows a provider with a unique and simpler approach to quickly gain market share. Per Figure 2, Rocket Mortgage market share of total originations improved from 1.3% in 2009 to 8.7% through the six months ended June 30, 2020.
Figure 2: Rocket Mortgage Market Share: 2009 – First Half of 2020
Sources: New Constructs, LLC and company filings
Rocket Companies’ focus on speed, efficiency, and ease of use not only drives its market share, but it also improves the firm’s client retention. According to the firm, overall client retention reached 63% in 2019, and refinancing retention reached 76%, which is well above the industry average of 22%. Year-to-date in 2020, overall client retention has grown to 75%.
Middleman Business Provides Less Exposure to Risky Loans
As an originator, the Rocket Companies operates a capital light business and holds less credit exposure than a traditional lender or bank. The firm originates mortgage loans that are sold to government-backed entities or to investors in the secondary market. The firm notes most sales occur within three weeks of origination, in turn requiring minimal capital.
The firm’s focused, capital light approach to lending drives Rocket Companies’ 19% ROIC, which is well above its online lending peer LendingTree (TREE) at 7%. Rocket Companies’ ROIC is also higher than each of the four largest (by revenue) traditional banks, JPMorgan & Chase (JPM), Bank of America, (BAC), Wells Fargo (WFC) and Citigroup (C), which it competes against for mortgage origination business.
Rocket Companies also takes on less credit exposure than traditional lenders because it sells all the loans it originates. As the firm notes in its S-1, “we do not have direct credit exposure to the servicing portfolio since we do not own the underlying loans that are being serviced.”
Despite earning a higher ROIC and minimal credit exposure, Rocket Companies, as any lender, is still highly reliant upon interest rates to drive business.
Rocket Companies Is Still Dependent Upon Interest Rates
No amount of automation and efficiency could remove Rocket Companies’ dependency on low interest rates. Lower interest rates make purchasing a new home more affordable and increase the number of consumers able to refinance existing loans.
The latter is more important to Rocket Companies’ business, as only 27% of the firm’s originations in 2019 were to clients purchasing a home. Rising rates would make it economically unfeasible for many consumers to refinance their loans after the recent period of record low interest rates, and the firm recognizes as much. The firm notes in its S-1:
“if interest rates rise and the market shifts to purchase originations, our market share could be adversely affected if we are unable to increase our share of purchase originations.”
At the same time, rising rates create a double-edged sword. Demand for refinancing activity would decline, and new home purchases would be more expensive, which could also decrease demand. Additionally, refinancing demand might stall if interest rates remain at record lows for the foreseeable future.
Public Shareholders Have No Rights
Rocket Companies went public with a multi-class share structure. The Class A shares sold to the public will have one vote per share, while the Class D shares will have 10 votes per share. Class D shares will be held by Rock Holdings (a holding company co-owned by founder and chairman Dan Gilbert) and Dan Gilbert. Combined Rock Holdings and Dan Gilbert will hold ~80% of the voting rights in the company, which means public shareholders will effectively have no say in corporate governance – a trend becoming all too normal.
DCF Model Reveals High Expectations
When we use our reverse DCF model to analyze the future cash flow expectations baked into RKT, we find that, despite pricing below its initial expected range, shares are still fully valued.
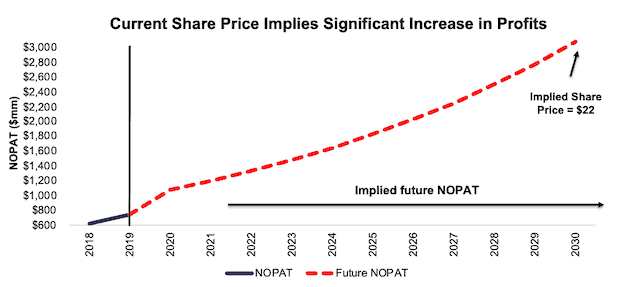
In order to justify its current price of $21/share, Rocket Companies must achieve a 14% NOPAT margin (average of all Consumer Lending firms that earn a positive margin, compared to Rocket Companies’ 11% in 2019) and grow revenue by 11% compounded annually for the next 11 years. See the math behind this reverse DCF scenario. For reference, Rocket Companies has grown revenue by 11% compounded annually since 2017.
In this scenario, Rocket Companies would earn $21.6 billion in revenue in 2030, or more than three times the firm’s 2019 revenue. While Rocket Companies estimates its total addressable market is upwards of $5.5 trillion, third-party research provider Grand View Research projects the global digital lending platform market will be worth $16 billion in 2026.
Figure 3 compares the firm’s implied future NOPAT in this scenario to its historical NOPAT.
Figure 3: Current Valuation Implies Large Profit Growth
Sources: New Constructs, LLC and company filings.
If we assume Rocket Companies can maintain its current NOPAT margin (11%) and still grow revenue by 11% compounded annually for the next decade, the stock is worth just $15/share today, a 32% downside to the current price. See the math behind this reverse DCF scenario.
While this scenario may prove conservative should interest rates remain at record lows, thereby increasing the number of consumers able to refinance, the upside in owning RKT is limited given the expectations already baked into the stock price, as shown in Figure 3. Yes, Rocket Companies is a newly public company that actually makes money, but from a risk/reward standpoint, there are better opportunities in the current market.
Critical Details Found in Financial Filings by Our Robo-Analyst Technology
As investors focus more on fundamental research, research automation technology is needed to analyze all the critical financial details in financial filings as shown in the Harvard Business School and MIT Sloan paper,"Core Earnings: New Data and Evidence”.
Below are specifics on the adjustments we make based on Robo-Analyst findings in Rocket Companies’ S-1:
Income Statement: we made $693 million of adjustments, with a net effect of removing $693 million in non-operating expenses (10% of revenue). You can see all the adjustments made to Rocket Companies’ income statement here.
Balance Sheet: we made $393 million of adjustments to calculate invested capital with a net decrease of $392 million. One of the most notable adjustments was $5 million, which represents the difference between reported operating leases and our calculation of operating leases. This adjustment represented less than 1% of reported net assets. You can see all the adjustments made to Rocket Companies’ balance sheet here.
Valuation: we made $328 million of adjustments with a net effect of decreasing shareholder value by $328 million. There were no adjustments that increased shareholder value. Apart from total debt, which includes the operating leases noted above, the largest adjustment to shareholder value was $14 million in deferred tax liabilities. This adjustment represents <1% of Rocket Companies’ market cap. See all adjustments to Rocket Companies’ valuation here.
This article originally published on August 12, 2020.
Disclosure: David Trainer, Kyle Guske II, and Matt Shuler receive no compensation to write about any specific stock, style, or theme.
Follow us on Twitter, Facebook, LinkedIn, and StockTwits for real-time alerts on all our research.
[1] Our core earnings are a superior measure of profits, as demonstrated in Core Earnings: New Data & Evidence a paper by professors at Harvard Business School (HBS) & MIT Sloan. The paper empirically shows that our data is superior to “Operating Income After Depreciation” and “Income Before Special Items” from Compustat, owned by S&P Global (SPGI).