We published an update on JPM on May 4, 2022. A copy of the associated Earnings Update report is here.
We closed the CAT position on July 19, 2021. A copy of the associated Position Update report is here.
We closed the SPG position on November 16, 2021. A copy of the associated Position Update report is here.
Reliable research provides investors with an advantage in times of uncertainty. Our superior earnings analysis[1] shows that the COVID-19-induced market turmoil left many high-quality stocks severely undervalued. Since April, we’ve identified several companies with strong underlying earnings and valuations implying profits would never recover from COVID-induced lows.
Our “See Through the Dip” thesis acknowledges that most of these firms’ profits are on the decline in the short term, however, their fundamentals, along with ample liquidity, will enable them not just to survive the economic downturn, but also thrive in a recovery. These stocks should be held through the market turmoil as we expect them to outperform the crowded passive strategies over the long term.
Simon Property Group (SPG: $68/share), JPMorgan Chase & Company (JPM: $94/share), and Caterpillar Inc. (CAT: $127/share) are three stocks previously featured that remain particularly undervalued. These three stocks are this week’s Long Ideas.
See Through the Dip to Find Value
Figure 1 shows that 10 out of the 18 stocks that we have recently featured in our “See Through the Dip” articles have outperformed the S&P 500 since being published.
Figure 1: See Through the Dip Stocks Vs. S&P 500 – Prices through June 30, 2020
Sources: New Constructs, LLC and company filings.
These 18 stocks are not only undervalued, but the underlying businesses are strong and ready to grow in the economic recovery. Further, each company shares the following:
- Strong cash position to survive the economic downturn
- Positive and rising core earnings
- Superior and/or faster rising return on invested capital (ROIC) compared to peers
- Strong market position in their respective industry
- Valuations that imply profits never recover
Investors looking for long-term-value-creating stocks in this volatile market should start here.
Simon Property Group (SPG) – Attractive rating
We made Simon Property Group a Long Idea on April 20, 2020. Since then, the stock is up 27% (S&P 500 +10%). While the stock has outperformed, the underlying fundamentals of the business give it plenty more upside potential.
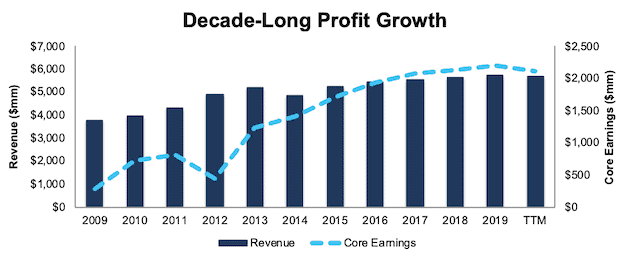
Over the past decade, Simon Property Group grew revenue by 4% compounded annually and core earnings by 23% compounded annually. The firm has grown revenue by 6% compounded annually and core earnings by 11% compounded annually over the past two decades. The firm increased its core earnings margin year-over-year (YoY) in nine of the past 10 years and its TTM core earnings margin of 37% is up from 8% in 2009.
Per Figure 2, the decline in core earnings over the TTM is the beginning of “the dip” and is evidence of COVID-19’s impact on the firm’s operations. This decline is in line with our thesis. In our original report, we evaluated a worst-case scenario in which Simon Property Group’s NOPAT drops 60% in 2020 and 15 years after the pandemic is 12% below its 2019 NOPAT. We believe this scenario is unlikely given that the firm announced on June 29, 2020 that 199 of its 204 U.S. retail properties were already reopened.
Figure 2: Simon Property Group’s Revenue & Core Earnings Since 2009
Sources: New Constructs, LLC and company filings
Simon Property Group leverages its rising profitability to generate significant free cash flow (FCF). The firm has generated positive FCF in eight of the past 10 years and a cumulative $14.8 billion (71% of market cap) in cumulative free cash flow over the past five years.
ROIC Is Improving
Before the COVID-19 pandemic, Simon Property Group’s profitability was trending higher while peers’ was declining.
Simon Property Group’s net operating profit (NOPAT) margin improved from 56% in 2015 to 58% in 2019, while the market-cap-weighted average NOPAT margin of the firm’s mall REIT peers fell from 33% to 29% over the same time. NOPAT is our adjusted version of funds from operations (FFO). Peers in the group include CBL & Associates (CBL), Pennsylvania Real Estate Investment Trust (PEI), Taubman Centers (TCO), The Macerich Company (MAC), Washington Prime Group (WPG), and Tanger Factory Outlet Centers (SKT).
Simon Property Group’s capital efficiency is also well above its peer group. The firm slightly improved its invested capital turns from 0.19 in 2015 to 0.20 in 2019, while the market-cap-weighted average invested capital turns of its peer group remained at 0.14 over the same time.
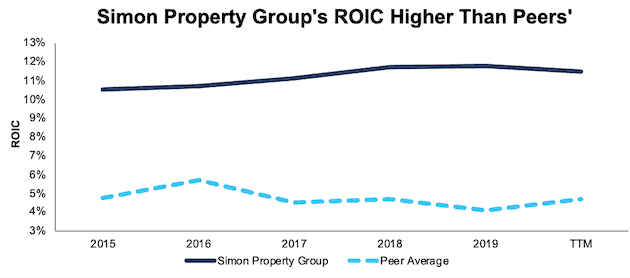
The combination of rising margins and invested capital turns drives Simon Property Group’s ROIC higher. The firm improved its ROIC from 11% in 2015 to 12% in 2019. Per Figure 3, the market-cap-weighted average ROIC of peers actually fell from 5% to 4% over the same time.
Figure 3: Simon Property Group’s Superior ROIC
Sources: New Constructs, LLC and company filings
SPG Still Has Upside Potential
At its current price of $68/share, SPG has a price-to-economic book value (PEBV) ratio of 0.7. This means the market expects Simon Property Group’s after-tax profit (NOPAT) to permanently decline by 30%. This expectation seems extremely pessimistic and shortsighted. For reference, Simon Property Group’s NOPAT fell just 12% year-over-year (YoY) in 2009 and, then grew nearly 37% YoY in 2010, which put profits at a then all-time high.
SPG’s current economic book value is $92/share – a 35% upside to the current price.
If we assume, as does the International Monetary Fund (IMF), Fitch Ratings, and nearly every economist in the world, that the global economy rebounds and returns to growth starting in 2021, SPG is undervalued.
In this scenario, we assume:
- Margins remain at 58% (equal to 2019)
- Revenue falls 25% in 2020 (vs. consensus of -13%)
- Sales growth returns in 2021 at 4% per year, which equals SPG’s revenue CAGR over the past decade
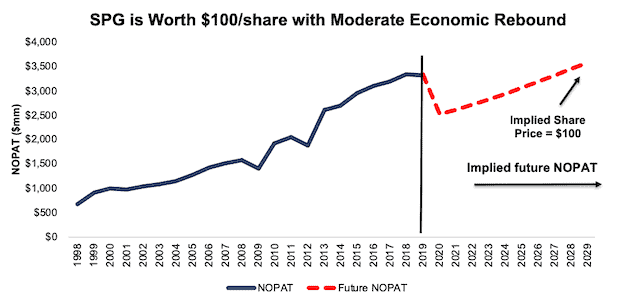
In this scenario, where Simon Property Group’s NOPAT grows just 1% compounded annually over the next decade (including a 25% drop in 2020), the stock is worth $100/share today – a 47% upside to the current price. See the math behind this reverse DCF scenario.
Figure 4 compares the firm’s implied future NOPAT to its historical NOPAT in this scenario.
Figure 4: Implied Profits Assuming Moderate Recovery
Sources: New Constructs, LLC and company filings
JPMorgan Chase & Company (JPM) – Very Attractive Rating
We made JPMorgan a Long Idea on May 21, 2020. Since then, the stock is up 4% while the S&P 500 is up 5%. We believe the firm’s fundamentals, along with its ability to assist in the economic recovery, presents a great opportunity for this stock to outperform the S&P 500 going forward.
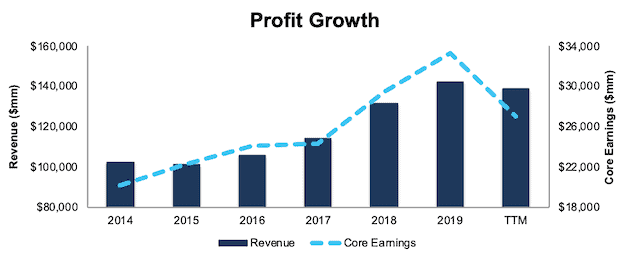
Over the past five years, JPMorgan grew revenue by 7% compounded annually and core earnings by 11% compounded annually. The firm increased its core earnings margin YoY in eight of the past 10 years and from less than 11% in 2009 to 19% TTM.
Per Figure 5, the drop in profits over the TTM period is what we call “the dip” and is in line with our expectations for COVID-19’s impact on the overall economy. In our original report, we evaluated a worst-case scenario where JPMorgan’s NOPAT declines 18% compounded annually from 2019 to 2024. This scenario seems very unlikely given the leadership role the banking industry has played during this crisis in helping the economy recover.
Figure 5: JP Morgan’s Profitability Growth Since 2014
Sources: New Constructs, LLC and company filings
JPMorgan’s improving profitability helps the business generate significant FCF. The company generated positive FCF in each of the past 10 years and a cumulative $109 billion (38% of market cap) over the past five years. JPMorgan’s $31 billion in FCF over the TTM equates to a 10% FCF yield, which is significantly higher than the Financials Sector average of 3%.
Superior ROIC
JPMorgan’s superior profitability positions it to take the market share lost by weaker operators and return to pre-crisis profit growth when the economy recovers.
JPMorgan’s invested capital turns rank highest among the four largest (by revenue) banks, which include JPMorgan, Bank of America Corp (BAC), Wells Fargo & Company (WFC), and Citigroup Inc. (C). The firm’s NOPAT margin of 25% ranks second highest among this group as well.
High margins and rising invested capital turns drive JPMorgan’s leading ROIC. Per Figure 6, JPMorgan’s current ROIC of 12% is greater than its banking peers and well above the 7% earned at the depths of the Financial Crisis in 2008.
Figure 6: Superior Profitability vs. Competitors

Sources: New Constructs, LLC and company filings
JPM Trades at a Discount
Despite entering the current crisis from a position of strength, JPM is down 31% YTD and now trades at its cheapest PEBV ratio (0.6) since 2012, and nearly equal to 2009. This ratio means the market expects JPMorgan’s NOPAT to permanently decline by 40%. This expectation seems overly pessimistic over the long term.
JPMorgan’s current economic book value, or no-growth value, is $152/share – a 62% upside to the current price.
Below, we use our reverse DCF model to see what the stock could be worth given conservative assumptions about COVID-19’s impact on the economy and JPMorgan’s future growth in cash flows.
If we assume the global economy rebounds and returns to growth starting in 2021, JPM is highly undervalued.
In this scenario, we assume:
- NOPAT margins fall to 12% (equal to 2008 and lowest in the history of our model vs. 25% TTM) from 2020-2021 before rebounding to 21% (ten-year average) in 2022 and each year thereafter
- Revenue falls 13% in 2020 (same year-over-year decline as 2008) and grows in line with consensus estimates at 1.86% in 2021 and 1.89% in 2022
- Revenue grows 3.5% in 2023 and each year thereafter, which equals the average global GDP growth rate since 1961
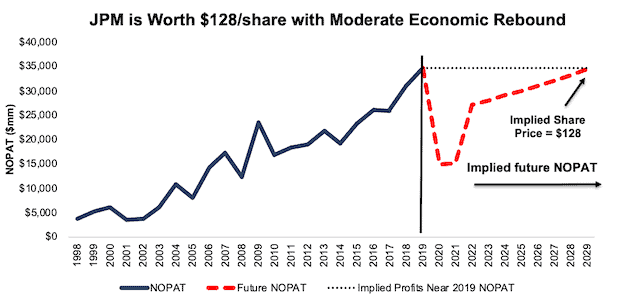
In this scenario, where JPMorgan’s NOPAT declines less than 1% compounded annually over the next decade (including a 57% YoY drop in 2020), the stock is worth $128/share today – a 36% upside to the current price. See the math behind this reverse DCF scenario.
For comparison, JPMorgan has grown NOPAT by 13% compounded annually over the past five years and 10% compounded annually over the past two decades. It’s not often investors get the opportunity to buy an industry leader at such a discounted price.
Figure 7 compares the firm’s implied future NOPAT to its historical NOPAT in this scenario. This scenario implies that ten years from now, the firm’s NOPAT will be 1% lower than its 2019 level. For context, JPMorgan exceeded its pre-Financial Crisis NOPAT level in just two years: the firm grew NOPAT from $17.2 billion in 2007 to $23.4 billion in 2009. If the firm’s profits return to the 2019 level in less than 10 years, JPM has even more upside potential.
Figure 7: Implied Profits Assuming Moderate Recovery
Sources: New Constructs, LLC and company filings
Caterpillar Inc. (CAT) – Very Attractive rating
We made Caterpillar a Long Idea on May 27, 2020. Since then, the stock is up 3% (S&P 500 +2%). The underlying fundamentals of the business give it plenty more room to grow in an economic recovery and outperform the S&P 500.
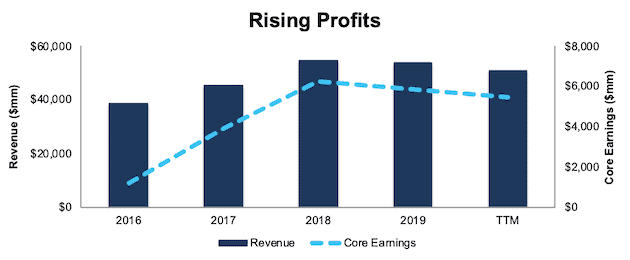
Caterpillar has a strong history of generating profits. Since 2016, Caterpillar grew revenue by 12% compounded annually and core earnings by 54% compounded annually, per Figure 8. Longer term, Caterpillar grew core earnings by 22% compounded annually over the past decade and 12% compounded annually over the past two decades. The firm increased its core earnings margin from 4% in 2016 to 11% TTM.
The decline in core earnings over the TTM is evidence of the impact COVID-19-driven disruptions have had on Caterpillar’s business and is in line with our “See Through the Dip” thesis. In our original report, we evaluated a worst-case scenario where Caterpillar’s NOPAT declines 1% compounded annually for 15 years after the pandemic (including an 84% YoY drop in 2020). This scenario seems highly unlikely given the global construction market is expected to grow by 4.3% compounded annually from 2020 to 2027.
Figure 8: Caterpillar’s Revenue & Core Earnings Since 2016
Sources: New Constructs, LLC and company filings
Caterpillar’s profitability helps the firm generate significant FCF. The firm generated positive FCF in 15 of the past 20 years and a cumulative $30.2 billion (44% of market cap) in FCF over the past five years. Caterpillar’s $7.7 billion in FCF over the TTM period equates to a 9% FCF yield, which is significantly higher than the Industrials sector average of 2%.
Superior and Improving ROIC
COVID-driven disruptions to the demand for industrial machinery may drive some weaker operators out of business for good. However, Caterpillar’s profitability was superior to its competitors before the crisis, and the firm is well-positioned to grow profits when the economy recovers.
Caterpillar’s NOPAT margin has improved from 7% in 2015 to 16% TTM. The firm’s current 16% NOPAT margin is much higher than the peer group’s market-cap-weighted average margin of 8%. Caterpillar’s peer group includes Deere & Company (DE), PACCAR Inc. (PCAR), Westinghouse Air Brake Technologies Corp (WAB), The Toro Company (TTC), WABCO Holdings, Inc. (WBC) and 17 additional Heavy Machinery & Vehicles firm.
Caterpillar’s capital efficiency has improved over the past four years as well. The firm improved its invested capital turns from 1.1 in 2015 to 1.4 in 2019, while the market-cap-weighted average invested capital turns of its peer group fell from 1.5 to 1.4 over the same time.
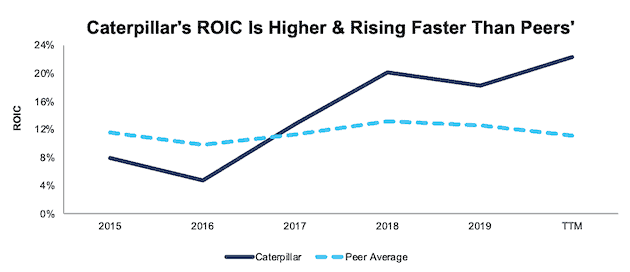
The combination of high and rising margins and improved invested capital turns drive Caterpillar’s ROIC higher. The firm improved its ROIC from 8% in 2015 to 22% TTM. Per Figure 9, the market-cap-weighted average ROIC of peers slightly fell from 12% to 11% over the same time.
Figure 9: Caterpillar’s Superior ROIC
Sources: New Constructs, LLC and company filings
CAT Remains Undervalued
At its current price of $127/share, CAT has a PEBV ratio of 0.6. This means the market expects Caterpillar’s NOPAT to permanently decline by 40%. This expectation seems overly pessimistic over the long term. For reference, Caterpillar grew NOPAT by 22% compounded annually over the past decade.
CAT’s current economic book value is $213/share – a 68% upside to the current price.
Below, we use our reverse DCF model to see what the stock could be worth given conservative assumptions about COVID-19’s impact on the economy and Caterpillar’s future growth in cash flows.
If we assume the global economy rebounds and returns to growth starting in 2021, CAT is undervalued.
In this scenario, we assume:
- NOPAT margins fall to 3% (all-time company low, 2009) in 2020 and increase to 7% (all-time company average) in 2021 to 2023 and 12% (2019 level) each year thereafter
- Revenue falls 25% (consensus estimate) in 2020
- Revenue grows at 8% in 2021 and in 2022 (consensus estimates) and 5% per year thereafter, which equals Caterpillar’s revenue CAGR over the past two decades
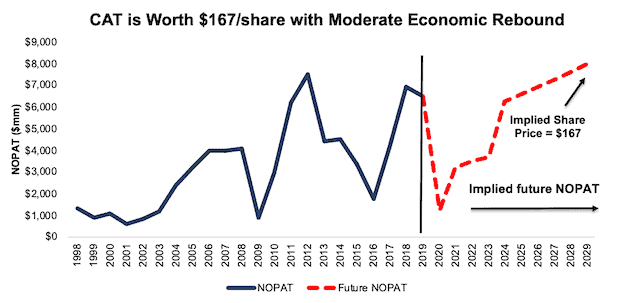
In this scenario, Caterpillar’s NOPAT only grows by 2% compounded annually over the next decade (and falls 81% YoY in 2020) and the stock is worth $167/share today – a 31% upside to the current price. This scenario also accounts for the firm’s debt issuance after the end of 1Q20. We conservatively assume this capital will be used to cover operating expenses and do not treat it as excess cash. See the math behind this reverse DCF scenario.
For comparison, Caterpillar has grown NOPAT by 8% compounded annually over the past five years and 10% compounded annually over the past two decades.
Figure 10 compares the firm’s implied future NOPAT to its historical NOPAT in the above scenario. This moderate scenario implies that a decade from now, Caterpillar’s NOPAT will be just 7% above 2012 levels and 23% above 2019 levels. If the firm’s profits return to these levels in less than 10 years, CAT has even more upside potential.
Figure 10: Implied Profits Assuming Moderate Recovery
Sources: New Constructs, LLC and company filings
The Importance of Reliable Fundamental Data
In volatile markets, it pays to incorporate accurate fundamentals into investment decision making. Having access to reliable data can reveal situations where the market has overly pessimistic expectations of fundamentally strong companies. It’s important that investors make decisions based on the best data available. Our Company Valuation Models incorporate all the data from financial filings to truly assess whether a firm is under or overvalued, get an accurate representation of the risk/reward of a stock, and make more informed investment decisions (rather than blindly allocating to indexes). For SPG, JPM, and CAT, as well as the other “See Through the Dip” stocks, the risk/reward looks good.
This article originally published on July 2, 2020.
Disclosure: David Trainer owns SYY, SPG, DHI, JPM, LUV, HCA, and H. David Trainer, Kyle Guske II, and Matt Shuler receive no compensation to write about any specific stock, sector, style, or theme.
Follow us on Twitter, Facebook, LinkedIn, and StockTwits for real-time alerts on all our research.
[1] Our core earnings are a superior measure of profits, as demonstrated in Core Earnings: New Data & Evidence a paper by professors at Harvard Business School (HBS) & MIT Sloan. The paper empirically shows that our data is superior to “Operating Income After Depreciation” and “Income Before Special Items” from Compustat, owned by S&P Global (SPGI).
