
Today’s U.S. stock market shows valuation levels that rival, and in some cases exceed, past bubbles. Both the S&P 500’s price-to-sales (P/S) ratio and (cyclically adjusted P/E) CAPE ratio are well above long-term averages and mirror levels not seen since before the dot-com crash in 2000. The Buffett Indicator (market cap to GDP) is higher than before both the 2000 and 2008 downturns.
These signals paint an unmistakable portrait: investors are buying up equities at levels rarely seen outside of bubble eras.
History suggests that when valuations detach this far from underlying earnings power, the bubble eventually pops and markets correct. Investors should remain selective and avoid companies whose valuations are most disconnected from their fundamental economics.
In honor of this top-heavy market, we’re bringing you two Danger Zone picks this week.
This company’s revenue growth is slowing, its profitability ranks at the bottom of its industry, and its cash burn lands it back on the Zombie Stock list.
We first put Five9 Inc. (FIVN: $26/share) in the Danger Zone and named it a Zombie Stock in December 2022. Most recently, we reiterated our bearish opinion on the stock in August 2024, but we removed it from our Zombie Stocks List.
Note that the short strategy based on our Zombie Stock List has outperformed the S&P 500 by 45% since inception in June 2022. See Figure 8.
However, the business is running low on cash again and qualifies as a Zombie Stock. So, Five9 is back on the Zombie Stock List.
Since our original report, FIVN has outperformed as a short by ~122%, falling 60% while the S&P 500 is up 63%.
Even with FIVN down 35%+ year-to-date (YTD), further downside remains in this stock.
Five9’s stock could fall further based on:
- consistently high cash burn and a short cash runway,
- slowing revenue growth,
- worst profitability in the industry,
- a stock valuation that implies Five9 will become larger than Zoom and Nice combined.
Figure 1: Five9 Outperformance as a Short From 12/5/22 Through 8/19/25
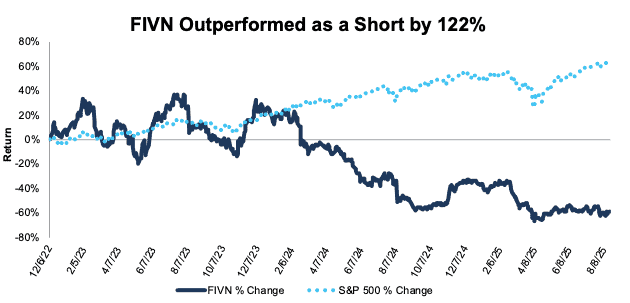
Sources: New Constructs, LLC
What’s Working
Five9 grew subscription revenue 16% year-over-year (YoY) in 2Q25. This growth was largely driven by enterprise AI revenue growth of 42%. Five9’s total revenue grew 12% YoY in 2Q25.
Five9’s management also increased its full year 2025 revenue guidance, which now equals 10% YoY. In the same release, management increased its adjusted EBITDA margin guidance by 1% for the same period.
What’s Not Working
Despite growing revenue in 2Q25 and guiding for YoY growth in the full year, Five9’s revenue growth has been slowing in recent years, while the company has yet to generate any annual profits since 2019. This business is a cash-burning machine and doesn’t have a long runway ahead of it, as we’ll show below.
Back on the Zombie Stocks List
Unprofitable companies with fast-depleting cash reserves are risky investments in any market. These risks are higher when the cost of raising capital is higher. Five9’s weighted average cost of capital (WACC) increased from 9.3% in 2019 to 10.1% in the TTM.
In August 2024 we removed FIVN from the Zombie Stocks List after the company issued senior convertible notes and increased cash on hand, which ultimately increased Five9’s cash runway to more than 24 months.
However, Five9’s cash on hand fell from $1.1 billion in the TTM ended 2Q24 to $636 million in the TTM ended 2Q25.
With this lower cash balance (and consistently negative FCF), Five9 can only sustain its TTM free cash flow (FCF) burn for 24 months from the end of August. The company also has a negative interest coverage ratio, and now officially earns its spot back on the Zombie Stocks List.
The company will likely need to raise expensive capital once again to avoid bankruptcy, unless it can engineer a turnaround in the profitability of its operations. Otherwise, the stock has a real risk of going to $0/share.
Figure 2: Five9 Is Back on the Zombie Stocks List

Sources: New Constructs, LLC and company filings.
* As of 6/30/25
** To calculate “Months till Bankruptcy” we divided the TTM FCF burn, excluding acquisitions, by 12 to get the monthly cash burn. We then divide reported cash and equivalents and long-term investments in the most recent 10-Q by the monthly cash burn.
Massive Cash Burn Continues
Five9’s FCF has been negative on an annual basis in eight of the ten years of our model (since 2015) and is negative in the TTM ended 2Q25. 2018 was the last annual period the company generated positive FCF. On a quarterly basis, the company generated a positive FCF in just one (3Q20) out of the last 20 quarters.
Since 2017, Five9 has burned through a cumulative $1.1 billion (47% of enterprise value) in FCF excluding acquisitions. In the TTM, the company’s cash burn sits at -$299 million.
Figure 3: Five9’s Cumulative Free Cash Flow: 2015 Through 1H25
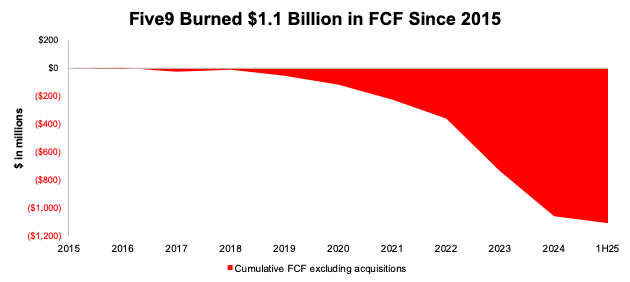
Sources: New Constructs, LLC and company filings
Shares Outstanding on the Rise
Despite regularly selling stock, the company is still low on cash. Per Figure 4, Five9’s shares have increased YoY every year since the company’s IPO in 2014.
Five9’s shares outstanding nearly doubled from 38 million shares at the end of 2014 to 76 million shares at the end of 2Q25.
Figure 4: Five9’s Shares Outstanding: 2014 – 2Q25
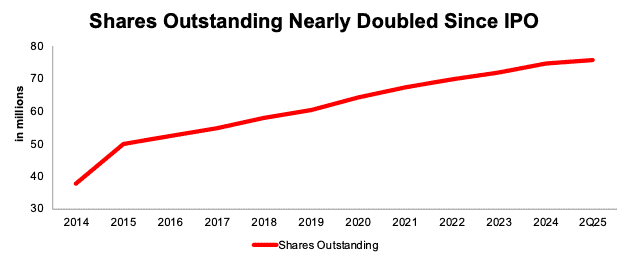
Sources: New Constructs, LLC and company filings
Revenue Growth Decelerating
Five9 continues to grow revenue, but its growth rates are on the decline. The company grew revenue YoY by:
- 33% in 2020
- 40% in 2021
- 28% in 2022
- 17% in 2023
- 14% in 2024
- 13% in 1H25
Going forward, management guided for 10% YoY revenue growth in 2025, a further slowdown from 2024.
Additionally, analysts expect Five9’s revenue growth to lag the forecasted contact center software industry growth rates in the coming years.
While analysts expect Five9’s revenue to grow 10% in the full year 2025 and 9% in both 2026 and 2027, Precedence Research estimates the cloud-based contact center market will grow more than twice as fast at 22% compounded annually from 2025-2034.
In recent years, Five9 managed to cut its costs down relative to revenue, which helped the company improve its net operating profit after tax (NOPAT). Five9’s total expenses fell from 110% of revenue in 2020 to 99% of revenue in the TTM.
However, despite the improvements, Five9’s NOPAT is still negative in the TTM, and has been negative in every year in our model since 2019. The company’s NOPAT sits at -$5 million in the TTM, while its return on invested capital (ROIC) is -1% over the same time.
Figure 5: Five9’s Revenue and NOPAT: 2020 – TTM
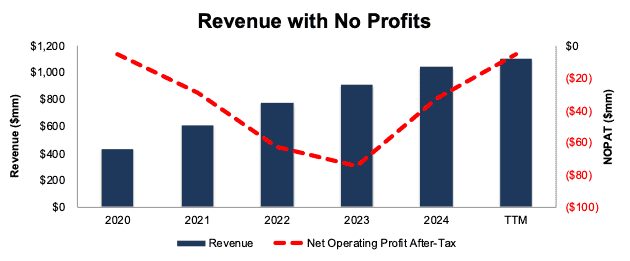
Sources: New Constructs, LLC and company filings
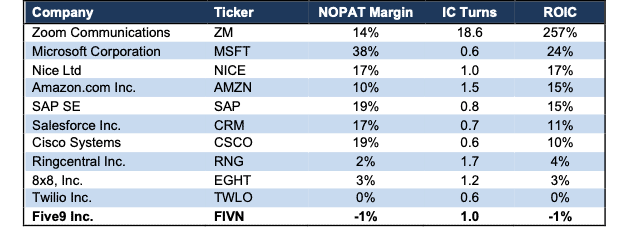
Competitors Are More Profitable
Five9 is the least profitable company among peers in its industry. Per Figure 6, Five9’s NOPAT margin and ROIC both rank below all peers, which include Zoom Communications (ZM) Microsoft Corporation (MSFT), SAP SE (SAP), Nice Ltd (NICE), Salesforce (CRM), Cisco Systems (CSCO), 8×8, Inc. (EGHT), Danger Zone stock Twilio (TWLO), fellow Zombie Stock Ringcentral (RNG), and more.
The companies that offer full-service solutions (that tie in their contact center software solutions into their other offerings/products and offer a wider range of solutions as a one-stop shop), like Microsoft, Nice Ltd, and Cisco Systems, maintain competitive advantages over niche and singularly focused companies like Five9 and RingCentral.
Figure 6: Five9’s Profitability Vs. Competitors: TTM
Sources: New Constructs, LLC and company filings
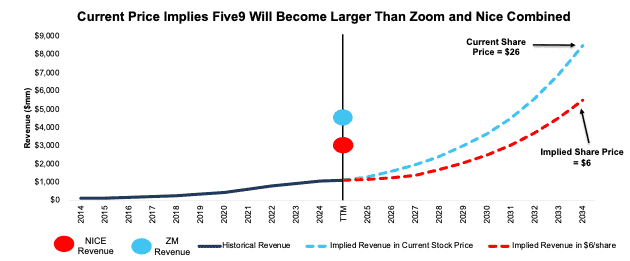
Current Price Implies Five9 Will Become Larger Than Zoom and Nice Combined
Below, we use our reverse discounted cash flow (DCF) model to analyze the revenue and future cash flow expectations baked into Five9’s stock price. We also present an additional DCF scenario to highlight the downside risk in the stock if Five9 fails to achieve these overly optimistic expectations.
To justify its current price of $26/share, our model shows that Five9 would have to:
- immediately improve NOPAT margin to 4% (double its best NOPAT margin of 2% in 2018 compared to -1% in the TTM) and
- grow revenue 23% (above consensus estimates in 2025 (10%), 2026 (9%), and 2027 (9%) and the projected industry CAGR of 22%) compounded annually through 2034.
In this scenario, Five9’s revenue would reach $8.5 billion in 2034 or nearly 8x the company’s TTM revenue, 3x Nice’s (NICE) TTM revenue, and nearly double Zoom’s (ZM) TTM revenue. For reference, Zoom and Nice’s combined revenue equals $7.5 billion in the TTM.
This scenario also implies that Five9’s NOPAT improves to $372 million in 2034, compared to -$5 million in the TTM and the company’s record NOPAT of $6 million in 2018.
In other words, to justify its current valuation, Five9 must immediately improve margins to 2x its best-ever level, while also growing revenue faster than the industry. Contact us for the math behind this reverse DCF scenario.
Keep in mind, the number of companies that grow revenue by 20%+ for such a long period are also “unbelievably rare”, making the expectations in Five9’s share price look even more unrealistic.
75%+ Downside If Revenue Grows at Consensus and Industry Forecast Rates
If we instead assume Five9:
- immediately improves NOPAT margin to 2% (equal to record NOPAT margin, compared to -1% in the TTM),
- grows revenue at consensus rates in 2025 (10%), 2026 (9%), and 2027 (9%), and
- grows revenue by 22% each year thereafter though 2034 (equal to projected industry CAGR), then
the stock would be worth just $6/share today – a 77% downside to the current price.
This scenario implies that Five9 generates $5.5 billion in revenue in 2034, which would be 5x its TTM revenue. In this scenario, Five9 would also generate $121 million in NOPAT in 2034. Contact us for the math behind this reverse DCF scenario.
Figure 7 compares Five9’s implied future revenue in these scenarios to its historical revenue. For reference, we also include the TTM revenue of competitors Zoom (ZM) and Nice (NICE).
Figure 7: Five9’s Historical and Implied Revenue: DCF Valuation Scenarios
Sources: New Constructs, LLC and company filings
Stock is Still Not Worth $1
Each of the above scenarios assume Five9 grows revenue, NOPAT, and FCF without increasing working capital or fixed assets. This assumption is highly unlikely but allows us to create best-case scenarios that demonstrate the high level of expectations embedded in the current valuation. For reference, Five9’s invested capital has grown 27% compounded annually since 2014. If we assume Five9’s invested capital increases at a similar rate in the DCF scenarios above, the downside risk is even larger.
Given that the performance required to justify its current price is overly optimistic, we dig deeper to see if Five9 is worth buying at any price. The answer is no.
The company owes $700 million in total debt, has $1 million in underfunded pensions, $3 million in outstanding employee stock option liabilities, and just $359 million in excess cash.
Five9 has an economic book value, or no growth value, of -$5/share. In other words we do not think equity investors will ever see $1 of economic earnings under normal operations, which means the stock would be worth $0 today.
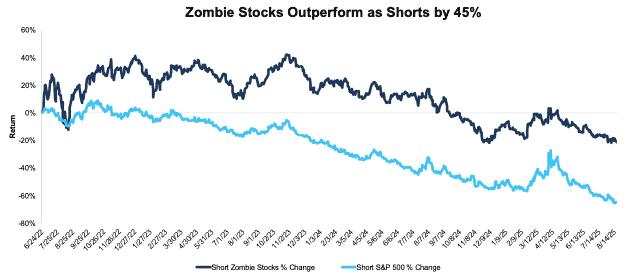
The Zombie Stock List Beats the S&P 500 by 45%
We started our Zombie Stock List in June 2022 and have added a total of 33 stocks to the list. After this report, 13 stocks remain on the list. The short strategy based on our Zombie Stock List has outperformed the S&P 500 by 45% since inception in June 2022. See Figure 8.
Companies are removed from the list when:
- their stock prices have fallen close to $0,
- they have extended their cash runway by raising capital,
- they have been acquired and saved from going to $0, or
- they have turned their businesses around and look like they will avoid bankruptcy.
Prior reports where we removed stocks from the Zombie Stock List are here, here, here, here, here, here, here, here, here, here, and here.
When we select companies to add to the Zombie Stock list, we look for companies that have:
- less than 24 months of cash to sustain their high cash burn, and
- a negative interest coverage ratio (EBIT/Interest expense).
The Full Zombie Stock List Below
Figure 8 shows all 33 Zombie Stocks. We mark those that have been removed from the list with an asterisk.
Figure 8: Zombie Stock Reports: With Performance Since Publish Date Through 8/19/25
| Company Name | Ticker | Date Added | Return Since Add Date | Return as Short Vs. S&P 500 |
| Freshpet Inc.* | FRPT | 6/23/22 | -16% | 9% |
| Peloton Interactive | PTON | 6/23/22 | -29% | 93% |
| Carvana Co. | CVNA | 6/23/22 | 992% | -928% |
| Snap Inc.* | SNAP | 7/22/22 | 9% | 36% |
| Beyond Meat, Inc. | BYND | 8/1/22 | -93% | 149% |
| Rivian Automotive* | RIVN | 8/8/22 | -61% | 94% |
| DoorDash, Inc. | DASH | 8/10/22 | 219% | -166% |
| Shake Shack, Inc.* | SHAK | 8/10/22 | 112% | -75% |
| AMC Entertainment | AMC | 8/15/22 | -99% | 148% |
| GameStop Corporation* | GME | 8/15/22 | -68% | 69% |
| Chewy Inc.* | CHWY | 8/17/22 | -55% | 57% |
| Uber Technologies* | UBER | 8/17/22 | 146% | -112% |
| Robinhood Markets* | HOOD | 8/22/22 | 307% | -261% |
| Tilray Brands* | TLRY | 9/7/22 | -49% | 92% |
| Affirm | AFRM | 9/19/22 | 234% | -167% |
| Sunrun | RUN | 9/22/22 | -50% | 123% |
| Blue Apron * | APRN | 9/26/22 | -79% | 95% |
| RingCentral | RNG | 10/3/22 | -30% | 99% |
| Allbirds Inc.* | BIRD | 10/17/22 | -71% | 89% |
| Wayfair | W | 11/14/22 | 87% | -27% |
| Atlassian* | TEAM | 11/16/22 | 43% | -32% |
| Bill.com | BILL | 11/16/22 | -65% | 127% |
| Okta* | OKTA | 11/16/22 | 47% | -2% |
| Oatly* | OTLY | 11/21/22 | -62% | 71% |
| Twilio* | TWLO | 11/23/22 | 39% | 4% |
| Ceridian* | CDAY | 11/23/22 | -3% | 11% |
| Redfin* | RDFN | 11/30/22 | 100% | -61% |
| Five9 Inc.* | FIVN | 12/5/22 | -37% | 72% |
| Opendoor* | OPEN | 1/30/23 | -9% | 50% |
| Compass Inc. | COMP | 2/6/23 | 98% | -44% |
| Sweetgreen Inc. | SG | 3/13/23 | 35% | 29% |
| Lucid Group* | LCID | 4/10/23 | -23% | 31% |
| Trupanion* | TRUP | 5/1/23 | 4% | 34% |
| Five9 Inc. | FIVN | 8/20/25 | n/a | n/a |
| Overall Portfolio Return | 19% | 45% | ||
Sources: New Constructs, LLC and company filings.
*Stocks removed from the Zombie Stock List. Performance tracked through the date each was removed. Linked report goes to the report in which the stock was removed.
Since our first report on June 23, 2022, the Zombie Stocks as shorts are down 19% while shorting the S&P 500 is down 64%. See Figure 9.
Figure 9: Combined Performance of Zombie Stocks List Through 8/19/25
Sources: New Constructs, LLC and company filings.
This article was originally published on August 20, 2025.
Disclosure: David Trainer, Kyle Guske II, and Hakan Salt receive no compensation to write about any specific stock, sector, style, or theme.
Questions on this report or others? Join our online community and connect with us directly.