Check out this week’s Danger Zone interview with Chuck Jaffe of Money Life.
We first brought attention to this firm in our special report “Selling Shovels in a Gold Rush: Buy This Sector to Profit From the Internet of Things.” In this report, we pointed out that this company broke the trend of rising profits and ROIC, but still garnered a premium valuation to its peers. This disconnect, between fundamentals and valuation, coupled with a weak competitive position and misaligned executive incentives make PDF Solutions (PDFS: $16/share) this week’s Danger Zone pick.
Slight Revenue Growth While Profits Tank
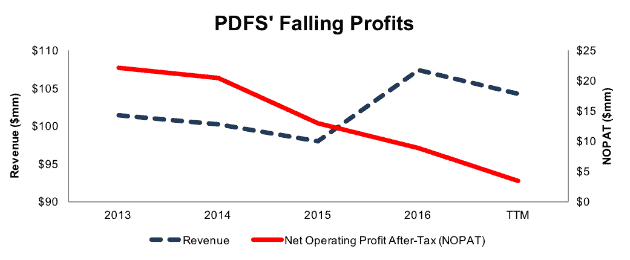
Since 2013, PDFS’ revenue has grown 2% compounded annually. Over the same time, its after-tax profit (NOPAT) has fallen 26% compounded annually to $9 million in 2016 and $3 million over the last twelve months (TTM), per Figure 1. The disconnect between revenue and profits comes from rapidly declining margins. The company’s NOPAT margin fell from 22% in 2013 to 3% TTM.
Figure 1: PDFS’ NOPAT & Revenue Since 2013
Sources: New Constructs, LLC and company filings
Declining margins and inefficient capital use have knocked PDFS’ return on invested capital (ROIC) down from a once impressive 25% in 2013 to a bottom-quintile 3% TTM. Further, the company burned through $22 million (5% of market cap) in free cash flow in 2016. The firm’s -$26 million in FCF over the last twelve months equates to a -7% FCF yield, which is well below the 2% average of the stocks in the S&P 500.
The company’s $101 million in cash currently on the books would support the TTM cash burn rate for just under four years before the company would need a cash infusion via debt or dilutive share issuance.
Compensation Plan Means Execs Get Paid While Depleting Shareholder Value
PDF Solutions’ executive compensation plan fails to properly align executives’ interests with shareholders’ interests. The misalignment helps drives the profit decline shown in Figure 1 and allows executives to earn large bonuses while shareholder value is destroyed. Executives’ performance bonuses are tied to many different metrics, most of which fail to measure shareholder value creation. The metrics used include revenue growth, non-GAAP EBITDAR, and subjective measures such as leadership qualities, job scope, career with the company, and “long-term potential to enhance stockholder value.” The biggest red flag of these metrics is EBITDAR, which conveniently removes real operating expenses like stock-based compensation and restructuring charges.
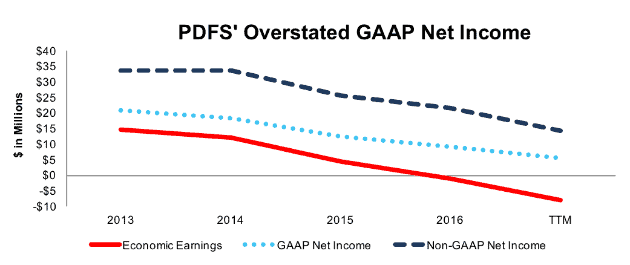
Not surprisingly, as executives are focused on non-shareholder value-creating metrics, PDFS’ economic earnings have fallen from $15 million in 2013 to -$8 million TTM.
We’ve demonstrated through numerous case studies that ROIC, not revenue, leadership qualities, or non-GAAP metrics, is the primary driver of shareholder value creation. A recent white paper published by Ernst & Young also validates the importance of ROIC (see here: Getting ROIC Right) and the superiority of our data analytics. Without major changes to this compensation plan (e.g. emphasizing ROIC), investors should expect further value destruction.
Non-GAAP Metrics Understate Profitability Decline
PDF Solutions is among a long list of firms that use non-GAAP metrics, such as EBITDA and non-GAAP net income, to mask the severity of declining profits. Our research digs deeper so our clients see through the illusory numbers. Below are some of the items PDF Solutions removes to calculate its non-GAAP net income:
- Stock-based compensation
- Amortization of acquired technology and intangible assets
- Acquisition costs
These adjustments have a large impact on the disparity between GAAP net income, non-GAAP net income, and economic earnings. While PDFS’ non-GAAP metrics are unable to hide declining profit, they make it appear less drastic over the past few years. Over the TTM period and 2016, PDFS removed $12 million (over 279% of TTM GAAP net income) and $11 million (over 120% of 2016 GAAP net income), respectively, in stock-based compensation expense to calculate non-GAAP net income. Combined with other adjustments, PDFS reported TTM non-GAAP net income of $14.4 million. Per Figure 2, GAAP net income was $4 million and economic earnings were -$8 million TTM.
Figure 2: PDFS’ Misleading Non-GAAP Metrics
Sources: New Constructs, LLC and company filings
Lagging Margins are Worrisome in A Highly Profitable Industry
PDF Solutions’ business covers a range of products and services aimed at enhancing yield and optimizing the design of integrated circuits. The larger industry of semiconductor equipment firms is characterized by rapid technological innovation and helps build the processors that power the growing list of connected devices. As with many technological industries, the semiconductor equipment market is filled with competition, ranging from large firms ASML Holdings (ASML), Applied Materials (AMAT), KLA – Tencor (KLAC) to smaller firms such as Kulicke & Soffa (KLIC), Orbotech (ORBK), and Rudolph Technologies (RTEC).
Over the past five years, this industry has exhibited significant improvement in ROIC and margins. Alarmingly, PDF Solutions has seen both ROIC and margins trend the opposite way as competition has ramped up. Per Figure 3, PDFS’ 3% ROIC falls well below the peer group average of 14% and the discrepancy is only getting worse.
Figure 3: PDF Solutions’ ROIC Lags Peers
Sources: New Constructs, LLC and company filings
In addition to PDF’s poor ROIC, its inability to grow margins in a booming industry create cause for concern. Per Figure 4, PDFS’ NOPAT margin has fallen in four consecutive years and the gap between PDF Solutions and the peer group average is growing. Success in the semiconductor equipment market is largely dependent on the ability to maximize yield while minimizing a client’s costs. With lagging margins, PDFS has limited flexibility to develop equipment to meet the demands of rapidly changing processing technology. At the same time, the firm is highly vulnerable to pricing competition as other firms can cut prices to levels that PDFS cannot afford while they still turn a profit.
Figure 4: PDF Solutions’ Margin Disadvantage is Growing Larger
Sources: New Constructs, LLC and company filings
Bull Case Ignores PDFS’ Dwindling Performance Incentive Segment
PDFS uses two-fold contracts when entering into an agreement with a client. An initial fee is negotiated, upon which PDFS will supply its equipment, services, software, and support for a set time period. In addition to this fee, PDFS negotiates performance incentives (Gainshare) based upon achieving a pre-determined yield goal or efficiency improvement goals. Unfortunately for PDFS, these performance incentives are driven by external catalysts which are out of PDFS’ control, such as the volume produced at semiconductor facilities. Declining Gainshare has led to the lackluster growth in revenue over the past four years. Since 2013, PDFS’ design-to-silicon revenue has grown 8% compounded annually while Gainshare revenue has fallen 9% compounded annually. Through the first nine months of 2017, Gainshare revenue is down nearly 8% year-over-year.
Management noted in the 3Q17 conference call that some customers’ volumes remain quite weak and they expect variability moving forward. Any delay in wafer production, which thereby limits volume, could lead to further declines in PDFS’ Gainshare revenue. Without this source of revenue, PDFS must find new clients to make up the difference. However, entering into new agreements historically takes a long time as there are several complex provisions that must be agreed upon and enforced.
As revenues have stagnated, PDFS’ cost structure has not. PDFS’ operating expenses are significantly outpacing revenue growth and thereby limiting profit potential. Per Figure 5, research & development, selling, general & administrative, and cost of design-to-silicon solutions have grown 23%, 9% and 5% compounded annually respectively. In order to develop solutions to serve the latest in wafer technology, any increase in revenue has been nullified as costs have eaten away at margins, as mentioned to earlier. Spending $2 to acquire $1 in revenue is not a winning strategy when there are numerous other competitors in the market that can easily afford to match pricing while remaining profitable.
Figure 5: PDFS’ Expenses Outpacing Revenue Growth
Sources: New Constructs, LLC and company filings
Looking beyond the declining Gainshare business and growing costs, PDFS’ customer concentration presents another risk to the bull case. In 2016, Global Foundries and Samsung Electronics represented 41% and 11%, respectively, of revenues. These two firms possess large scale benefits and also have negotiating power over PDFS given the importance to its business. Similarly, PDFS’ business would be at significant risk were these firms to develop in-house process control and/or testing systems.
When put together, these issues are at odds with PDFS’ current valuation, which is the ultimate risk to any bull thesis. As we’ll show below, the expectations embedded in the current stock price imply that PDFS will immediately grow profits at rates well above the recent trend.
PDFS’ Valuation Implies Unrealistic Profit Growth
PDFS has risen 49% over the past two years, while the S&P is up just 27% over the same time. More recently though, PDFS is down 29% year-to-date as investors have taken notice of the firm’s issues, but shares could still have further to fall. With falling NOPAT, margins, and ROIC there remains a disconnect between the company’s current financial performance and the significantly higher profits implied by the stock’s market value.
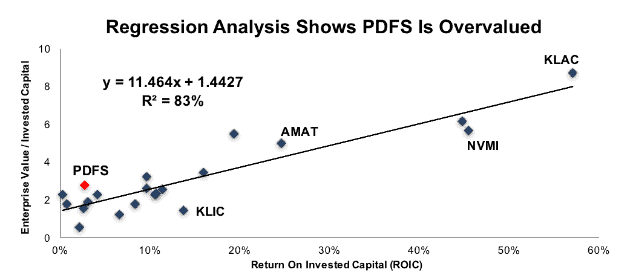
Figure 6 shows PDFS and its semiconductor equipment peers compared on the basis of ROIC and enterprise value divided by invested capital (a cleaner version of price to book). As you can see, ROIC explains 83% of the changes in valuation for PDFS’ peers.
Figure 6: ROIC Explains 83% of Valuation for the Semiconductor Equipment Market
Sources: New Constructs, LLC and company filings
PDFS stands out as an outlier in Figure 6 and trades at a significant premium to its peers. If the stock were to trade a parity with the peer group, it would be $11/share – 31% below the current stock price. Given the firm’s deteriorating fundamentals it should be clear PDFS does not deserve such a premium valuation.
Our discounted cash flow model quantifies the expectations baked into that premium valuation. To justify its current price of $16/share, PDFS must maintain TTM NOPAT margins (after four consecutive years of margin decline) and grow NOPAT by 16% compounded annually for the next 13 years. This scenario seems overly optimistic given the firm’s declining profitability in recent years.
Even if we assume PDFS can cut costs to improve profitability, achieve an 8% NOPAT margin and grow NOPAT by 13% compounded annually for the next decade, the stock is still worth only $11/share today – a 31% downside.
Each of these scenarios also assumes PDFS is able to grow revenue, NOPAT and FCF without increasing working capital or investing in fixed assets. This assumption is unlikely but allows us to create optimistic scenarios that demonstrate just how high expectations embedded in the current valuation really are. For reference, PDFS’ invested capital has grown $12 million on average (11% of 2016 revenue) each year for the past five years.
Is PDFS Worth Acquiring?
The largest risk to any bear thesis is what we call “stupid money risk”, which means an acquirer comes in and pays for PDFS at the current, or higher, share price despite the stock being overvalued. Large and more profitable competitors in the market make an acquisition less likely. Competitors would be better suited to use their competitive advantage to outprice PDFS rather than ignore prudent stewardship of capital and destroy substantial shareholder value in an acquisition.
We show below how expensive PDFS remains even after assuming an acquirer can achieve significant synergies.
Walking Through the Acquisition Value Math
To begin, PDF Solutions has liabilities of which investors may not be aware that make it more expensive than the accounting numbers suggest.
- $8 million in outstanding employee stock options (2% of market cap)
- $4 million in off-balance-sheet operating leases (1% of market cap)
After adjusting for these liabilities, we can model multiple purchase price scenarios. Even in the most optimistic of scenarios, PDFS is worth less than its current share price.
Figures 7 and 8 show what we think Applied Materials (AMAT) should pay for PDFS to ensure it does not destroy shareholder value. AMAT competes with PDFS in its process control software and inline inspection segments and purchasing PDFS could not only eliminate a smaller competitor but also bring new technologies and equipment in house. However, there are limits on how much AMAT would pay for PDFS to earn a proper return, given the NOPAT and free cash flows (or lack thereof) being acquired.
Each implied price is based on a ‘goal ROIC’ assuming different levels of revenue growth. In both scenarios, the estimated revenue growth rate is -3% in year one and 17% in year two, which is the consensus estimate of revenue growth for the next two years. For the subsequent years, we use 17% in scenario one because it represents a continuation of next year’s expectations. We use 20% in scenario two because it assumes a merger with AMAT would create revenue synergies thorough increased exposure to AMAT’s large customer base.
We conservatively assume that AMAT can grow PDFS’ revenue and NOPAT without spending anything on working capital or fixed assets beyond the original purchase price. We also assume PDFS immediately achieves a 12% NOPAT margin, which is the average of AMAT’s and PDFS’ current NOPAT margin. For reference, PDFS’ TTM NOPAT margin is 3%, so this assumption implies immediate improvement and allows the creation of a truly best-case scenario.
Figure 7: Implied Acquisition Prices for AMAT To Achieve 8% ROIC
Sources: New Constructs, LLC and company filings.
Figure 7 shows the ‘goal ROIC’ for AMAT as its weighted average cost of capital (WACC) or 8%. Even if PDFS can grow revenue by 14% compounded annually with a 12% NOPAT margin for the next five years, the firm is worth less than its current price of $15/share. It’s worth noting that any deal that only achieves an 8% ROIC would be only value neutral and not accretive, as the return on the deal would equal AMAT’s WACC.
Figure 8: Implied Acquisition Prices for AMAT To Achieve 25% ROIC
Sources: New Constructs, LLC and company filings.
Figure 8 shows the next ‘goal ROIC’ of 25%, which is AMAT’s current ROIC. Acquisitions completed at these prices would be truly accretive to AMAT shareholders. Even in the best-case growth scenario, the most AMAT should pay for PDFS is $6/share (62% downside to current valuation). Even assuming this best-case scenario, AMAT would destroy nearly $200 million by purchasing PDFS at its current valuation. Any scenario assuming less than 14% compound annual growth in revenue would result in further capital destruction for AMAT.
Another Earnings Disappointment Could Send Shares Lower
Expectations for PDFS’ earnings have been significantly cut throughout 2017. 2017 EPS expectations have fallen 56% since the beginning of the year. Similarly, 2018 EPS expectations have fallen 48% since the end of 2016. Despite the cuts in consensus estimates, PDFS continues to miss lowered expectations. The company has reported EPS below consensus in three consecutive quarters and the stock has reacted accordingly.
- 1Q17 – missed top and bottom line expectations. PDFS fell 29% in the next five days
- 2Q17 – missed top and bottom line expectations. PDFS fell 18% in the next three days
- 3Q17 – missed bottom line expectations. PDFS fell 9% the following day
While expectations have been lowered, the stock still reflects overly optimistic profit growth, as highlighted above. If PDFS fails to meet a lowered bar again, the stock could see a similar crash to that of 1Q17, as investors realize the company’s services are struggling to find footing in a highly competitive market. In the 3Q17 conference call, management noted that they “expect variable volumes from customers”, which could negatively impact profitability in the short-term.
While we don’t attempt to predict exactly when the market will recognize the disconnect between expectations and reality, we know the impact of failing to meet expectations can be dangerous to investors’ portfolios. Even after a large drop in price throughout 2017, PDFS still represents an unfavorable risk/reward tradeoff.
Insider Trading is Minimal While Short Interest is Rising
Over the past 12 months, 66 thousand insider shares have been purchased and 209 thousand have been sold for a net effect of 143 thousand insider shares sold. These sales represent less than 1% of shares outstanding.
Short interest is currently 3.5 million shares, which equates to 11% of shares outstanding and over 21 days to cover. There has been a significant jump in short interest this year, as the number of shares sold short has nearly tripled since the end of 2016. Growing short interest would seem to imply we’re not the only ones who recognize the issues facing PDFS and its lofty valuation.
Auditable Impact of Footnotes & Forensic Accounting Adjustments[1]
Our Robo-Analyst technology enables us to perform forensic accounting with scale and provide the research needed to fulfill fiduciary duties. In order to derive the true recurring cash flows, an accurate invested capital, and an accurate shareholder value, we made the following adjustments to PDF Solutions’ 2016 10-K:
Income Statement: we made $2 million of adjustments with a net effect of removing less than $1 million in non-operating expense (<1% of revenue). We removed $1 million related to non-operating expenses and $1 million related to non-operating income. See all the adjustments made to PDFS’ income statement here.
Balance Sheet: we made $202 million of adjustments to calculate invested capital with a net decrease of $90 million. The most notable adjustment was $50 million (25% of reported net assets) related to asset write-downs. See all adjustments to PDFS’ balance sheet here.
Valuation: we made $118 million of adjustments with a net effect of increasing shareholder value by $95 million. The largest adjustment to shareholder value was $107 million in excess cash. This cash adjustment represents 22% of PDFS’ market cap. Despite increasing shareholder value, PDFS remains overvalued.
Unattractive Funds That Hold PDFS
The following funds receive our Unattractive-or-worse rating and allocate significantly to PDF Solutions, Inc.
- Cardinal Small Cap Value Fund (CCMSX) – 2.1% allocation and Very Unattractive rating
- Eaton Vance Small-Cap Fund (ETEGX) – 1.2% allocation and Very Unattractive rating
This article originally published on November 6, 2017.
Disclosure: David Trainer and Kyle Guske II receive no compensation to write about any specific stock, style, or theme.
Follow us on Twitter, Facebook, LinkedIn, and StockTwits for real-time alerts on all our research.
[1] Ernst & Young’s recent white paper, “Getting ROIC Right”, proves the superiority of our research and analytics.
Click here to download a PDF of this report.
Photo Credit: Lee Bennett (Flickr)


3 replies to "A Troubling Trend: Falling Profits in a Growing Market"
What is the yearly cost for these services ???
You can see our different membership levels and their prices here
PDFS falls 13% after 4Q17 and full-year earnings. Now down 24% since Danger Zone report while the S&P is up 6%.