
To demonstrate the difference our proprietary Adjusted Fundamental data makes, we wrote a series of reports that show how our Credit Ratings are more reliable than legacy firms’ ratings. These reports focused on the five ratios that drive our Credit Ratings: FCF to Debt, Cash to Debt, EBITDA to Debt, Interest Coverage, and Debt to Capital. Each report shows how our data drives materially different results compared to ratios and ratings based on unscrubbed data.
No Bias, More Coverage, and Better Analytics: A New Paradigm for Credit Ratings
Though legacy providers, e.g. Moody’s, S&P, and Fitch, have dominated the credit ratings industry for some time, our Credit Ratings offer these advantages:
- more coverage: ~2,700 companies vs. ~1,500 for S&P
- more frequent updates: we update all ~2,700 of our credit ratings quarterly while S&P updates ratings for ~400 companies per year
- free of conflicts of interest that continue to taint legacy ratings.
Most importantly, superior fundamental data drives material differences in our Credit Ratings and research compared to legacy firms’ research and ratings. This report will show how legacy credit ratings for 21% of S&P 500 companies are misleading because they rely on unscrubbed data.
Figure 1 shows the differences between each Traditional and Adjusted component ratio that drive our Credit Ratings.
Figure 1: Traditional Vs. Adjusted Ratio Distortion for the S&P 500
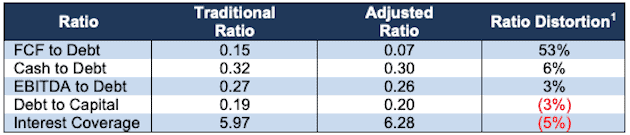
Sources: New Constructs, LLC and company filings.
Unscrubbed FCF to Debt Ratio Is Overstated by 53% for the S&P 500
Over the tailing-twelve-months (TTM), the difference between Traditional FCF of $1.3 trillion and Adjusted FCF of $666 billion causes Traditional FCF to be overstated by 50%[2]. Traditional Debt of $9.0 trillion and Adjusted Debt of $9.6 trillion cause Traditional Debt to be understated by 7% over the TTM. Overstated FCF and understated Debt drive the Traditional FCF to Debt ratio to be overstated by 53% for the S&P 500. Figure 2 shows the difference between Traditional and Adjusted FCF to Debt ratios since 2016 for the S&P 500. Get more details on the difference our data makes for the FCF to Debt ratio here.
Figure 2: Traditional Vs. Adjusted FCF to Debt Ratio for S&P 500
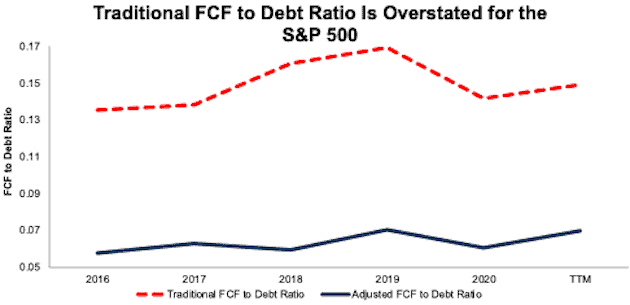
Sources: New Constructs, LLC and company filings.
Traditional Cash to Debt Ratio Is Overstated by 6% for the S&P 500
The Traditional and Adjusted Cash to Debt Ratios use the same value for Cash. However, Traditional Debt of $9.0 trillion and Adjusted Debt of $9.6 trillion cause Traditional Debt to be understated by 7% over the TTM. Understated Debt causes the Traditional Cash to Debt ratio to be overstated by 6% for the S&P 500. Figure 3 shows that the Traditional Cash to Debt ratio for the S&P 500 has been overstated since 2016. Get more details on the difference our data makes for the Cash to Debt ratio here.
Figure 3: Traditional Vs. Adjusted Cash to Debt Ratio for S&P 500
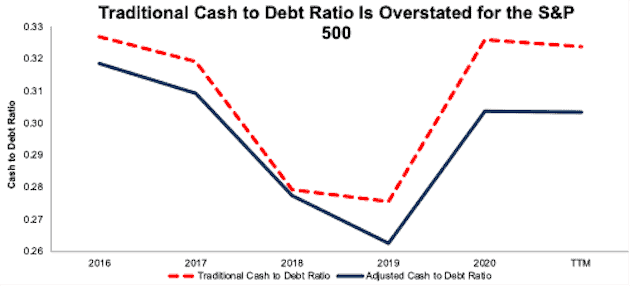
Sources: New Constructs, LLC and company filings.
Traditional EBITDA to Debt Ratio Is Overstated by 3% for the S&P 500
Over the TTM, Traditional EBITDA of $2.4 trillion is below Adjusted EBITDA of $2.5 trillion, which causes Traditional EBITDA to be understated by 4%. Traditional Debt of $9.0 trillion and Adjusted Debt of $9.6 trillion cause Traditional Debt to be understated by 7% over the TTM. Understated Debt drives the Traditional EBITDA to Debt ratio to be overstated by 3% over the TTM for the S&P 500. Figure 4 shows that the Traditional EBITDA to Debt ratio for the S&P 500 has been overstated since 2019. Get more details on the difference our data makes for the EBITDA to Debt ratio here.
Figure 4: Traditional Vs. Adjusted EBITDA to Debt Ratio for S&P 500
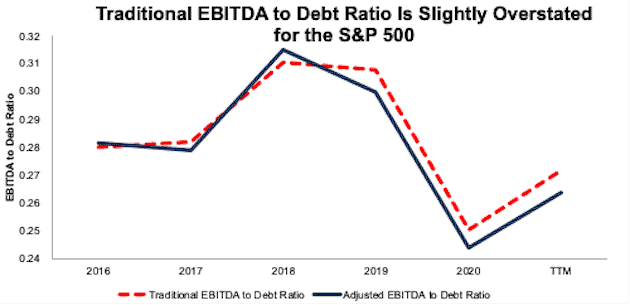
Sources: New Constructs, LLC and company filings.
Traditional Debt to Capital Ratio Is Understated by 3% for the S&P 500
Traditional Debt of $9.0 trillion and Adjusted Debt of $9.6 trillion cause Traditional Debt to be understated by 7% over the TTM. The difference between Traditional Capital of $48.1 trillion and Adjusted Capital of $48.7 trillion cause Traditional Capital to be understated by 1%. Understated Traditional Debt drives the Traditional Debt to Capital ratio to be understated by 3% for the S&P 500. Figure 5 shows that the Traditional Debt to Capital ratio for the S&P 500 has been understated every year since 2016. Get more details on the difference our data makes for the Debt to Capital ratio here.
Figure 5: Traditional Vs. Adjusted Debt to Capital Ratio for S&P 500
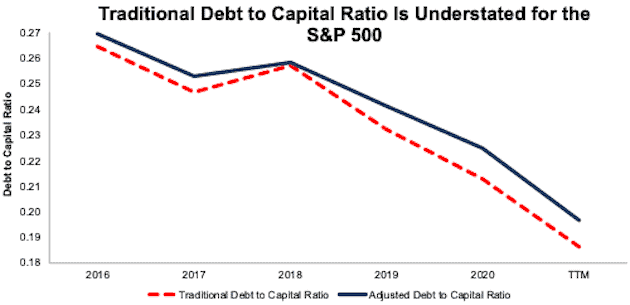
Sources: New Constructs, LLC and company filings.
Traditional Interest Coverage Ratio Is Understated by 5% for the S&P 500
Traditional EBIT of $1.7 billion is below Adjusted EBIT of $1.8 billion and is understated by 5%. The Traditional and Adjusted Interest Coverage Ratios use the same value for Interest Expense. Understated EBIT drives the Traditional Interest Coverage ratio to be understated by 5% for the S&P 500. Figure 6 shows that the Traditional Interest Coverage ratio for the S&P 500 has been understated since 2016. Get more details on the difference our data makes for the Interest Coverage ratio here.
Figure 6: Traditional Vs. Adjusted Interest Coverage Ratio for S&P 500
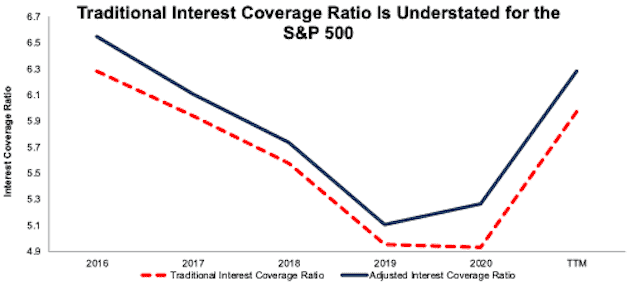
Sources: New Constructs, LLC and company filings.
Credit Ratings Based on Traditional Ratios Are Misleading
Not surprisingly, differences between Traditional and Adjusted ratios drive differences in our overall Credit Ratings.
Figure 7 shows how our Credit Ratings align with legacy firms’ ratings systems and the percentage of Credit Ratings that are different from ratings based on Adjusted ratios for companies in the S&P 500. Overall, 21% of Traditional Credit Ratings are different from our Credit Ratings because they rely on unscrubbed data.
As we explain in our Credit Ratings methodology, we set the thresholds for each component ratio in our Credit Ratings so that the distribution of our ratings is comparable to the distribution of ratings for legacy firms. We use the Traditional version of the component ratios to set thresholds so that the difference in our ratings comes from the difference in our data.
Figure 7: S&P 500: Percent of Credit Ratings That Are Misleading
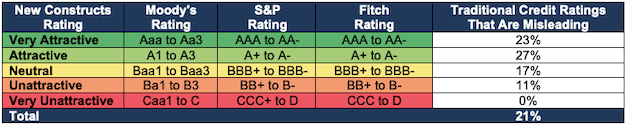
Sources: New Constructs, LLC and company filings.
Figure 8 provides more details on the number of companies whose Traditional Credit Ratings are different from our Credit Ratings based on Adjusted data.
For example, 52 out of 193 (27%) companies that earn an Attractive credit rating based on Traditional ratios earn a different rating based on Adjusted ratios.
Figure 8: S&P 500: Number of Misleading Credit Ratings[3]
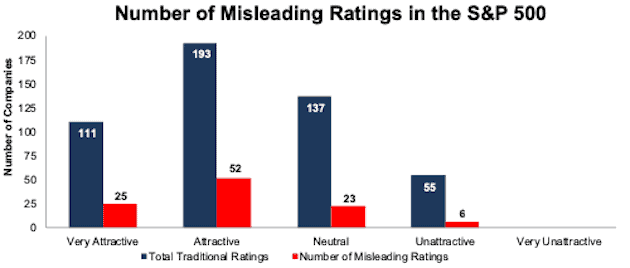
Sources: New Constructs, LLC and company filings.
For more details on our overall Credit Ratings, the ratios that drive the ratings, and individual company examples of the differences between traditional and adjusted data, click here.
This article originally published on July 16, 2021.
Disclosure: David Trainer, Kyle Guske II, Alex Sword, and Matt Shuler receive no compensation to write about any specific stock, style, or theme.
Follow us on Twitter, Facebook, LinkedIn, and StockTwits for real-time alerts on all our research.
[1] Ratio Distortion equals (Traditional Ratio – Adjusted Ratio) / absolute value of Traditional Ratio
[2] The negligible difference in FCF distortion between this report and FCF to Debt: Unscrubbed Data Creates Misleading Credit Ratings is due to new 10-Ks and 10-Qs incorporated in the underlying data since the first report.
[3] Due to a lack of available historical data to calculate a traditional FCF value, Carrier Global Corp (CARR), Amcor Plc (AMCR), Otis Worldwide Corp (OTIS), and L3harris Technologies Inc. (LHX) do not receive an Adjusted Credit Rating and are excluded from this analysis.