
The Industrials sector ranked fourth out of 11 sectors in our 4Q17 Sector Rankings for ETFs and Mutual Funds. The sector receives a Neutral rating based on an aggregation of ratings of 20 ETFs and 18 mutual funds in the Industrials sector.
The wide holdings variations among Industrials sector ETFs and mutual funds can create very different investment outcomes, and, therefore, ratings. Our Robo-Analyst technology helps investors navigate the sector by sifting through the holdings of all Industrials ETFs and mutual funds, which hold anywhere from 20 to 343 stocks. In the process, we uncovered a particularly attractive ETF that backward-looking fund research is likely to overlook.
This ETF ranks third among 38 Industrials sector ETFs and mutual funds, which include eight Attractive-or-better rated funds. This ETF has ranked in the top 5 of Industrials sector ETFs for six consecutive quarters. It is poised to remain near the top of the rankings based on its superior holdings and low total annual costs (TAC). The S&P Homebuilders SPDR (XHB) receives our Very Attractive fund rating and is also this week’s Long Idea.
Homebuilder Tailwinds Remain Favorable
We noted that cyclical trends were positive for the entire homebuilder subsector when we featured NVR Inc. (NVR) as a Long Idea in April 2017. Since then, the stock is up 35% while the S&P is up 9%, and positive tailwinds remain in place. The job market remains strong, as the unemployment rate continues to fall. The entire housing industry remains supply constrained, which has driven prices higher and provided greater margins for homebuilders. Higher prices have also led consumers to renovate and remodel their homes, which directly impacts housing supply firms such as Lowes (LOW) and Home Depot (HD). Additionally, existing supply of homes for sale has fallen each of the last four months, which provides an opportunity for homebuilders to attract new customers. All told, the subsector’s fundamental trajectory remains positive.
Holdings Analysis Reveals Favorable Allocations
The only justification for an ETF to charge higher fees than its passively managed ETF benchmark is “active” management that leads to out-performance. While XHB is technically classified as a “passive” Industrials sector ETF, we consider its concentrated homebuilders sub-sector focus to be an active management decision.
A fund is most likely to outperform if it has higher quality holdings than its benchmark. To make a determination on holdings quality, we leverage our Robo-Analyst technology to drill down to the individual stocks[1] of every fund. This capability empowers our unique holdings based ETF and mutual fund rating methodology.
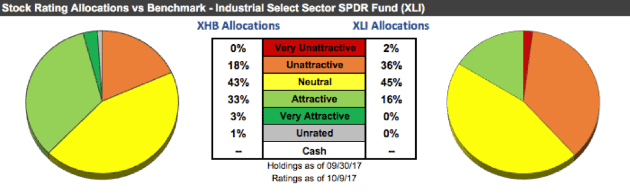
Figure 1: XHB Asset Allocation by Holding-Level Risk/Reward Rating
Sources: New Constructs, LLC and company filings
Per Figure 1, XHB allocates 36% of its assets to Attractive-or-better rated stocks compared to just 16% for the benchmark Industrials Select Sector SPDR Fund (XLI). The allocation to Neutral-rated stocks is nearly even (43% for XHB and 45% for XLI). Exposure to Unattractive-or-worse rated stocks favors KHB (18% of assets) over XLI (38% of assets).
Given the high allocation to Attractive-or-better rated stocks and minimal allocation to Unattractive-or-worse rated stocks relative to the benchmark XLI, XHB appears well positioned to capture upside potential while taking on a lower level of downside risk. Compared to the average ETF or mutual fund, XLI has a better chance of generating the outperformance required to justify its management fees above the cost of the XLI benchmark.
XHB Represents Industrials Sector “Value”
True value investing still works despite the proliferation of passive strategies. XHB is a good example of how to utilize a relatively low-cost, passively-managed ETF to make an “active” investment decision. The ETF’s sub-sector focus does an effective job allocating capital to higher-quality companies with lower relative valuations, the cornerstone of the value investing discipline.
Figure 2 contains our detailed fund rating for the S&P Homebuilders SPDR, which includes each of the criteria we use to rate all funds under coverage. These criteria are very similar to our Stock Rating Methodology, because the performance of a fund’s holdings equals the performance of a fund. The results of this analysis reveal important information for investors in XHB.
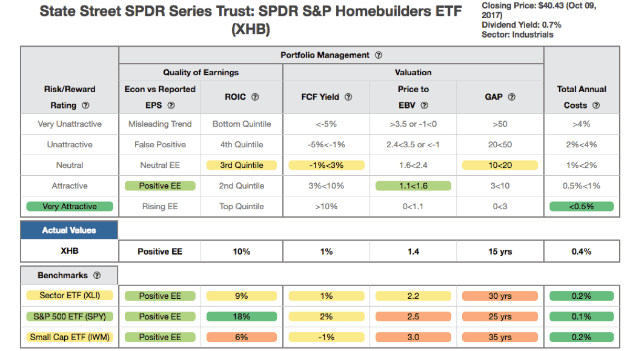
Figure 2: S&P Homebuilders SPDR (XHB) Rating Breakdown
Sources: New Constructs, LLC and company filings
The return on invested capital (ROIC) for XHB’s holdings is 10%, which is slightly better than the 9% ROIC earned by Industrials Select Sector SPDR holdings. Because there is little variation between the holdings of XHB and XLI in terms of ROIC, the primary advantage of XHB holdings is in their valuation and lower embedded market expectations.
The market-implied expectations for future profits baked into the prices of XHB holdings are meaningfully lower than for those for XLI holdings. The price to economic book value (PEBV) ratio for XHB is 1.4 compared to 2.2 for XLI. This ratio means the market expects the after-tax profits (NOPAT) of XLI stocks to increase 120% from current levels while XHB stocks are priced for expectations of 40% NOPAT growth from current levels.
Our discounted cash flow analysis of fund holdings reveals a market implied growth appreciation period (GAP) of 15 years for XHB, which is half the GAP of XLI’s holdings and below the 25-year GAP for the broad market (S&P 500). In other words, XHB constituents only have to grow economic earnings for half as long as companies held by XLI to justify their current stock prices. This expectation seems likely given that XHB holds more profitable firms as measured by ROIC.
Ultimately, the lowered profit growth expectations baked into the valuations of stocks held by XHB lowers the downside risk and makes outperformance more likely.
XHB Should Earn Its Relatively Modest Fees
With total annual costs (TAC) of 0.39%, XHB expenses are lower than 84% of Industrials sector ETFs and mutual funds under coverage. Coupled with its quality holdings, below average fees make XHB more attractive. For comparison, the average TAC of all Industrials sector ETF and mutual funds is 1.31%, the weighted average is 0.58%, and the ETF benchmark (XLI) has a TAC of 0.15%. XHB’s expense ratio closely approximates the true costs of investing in the fund as its 0.39% TAC is only 0.04% higher than its stated expense ratio.
Outperformance Looks Likely to Continue
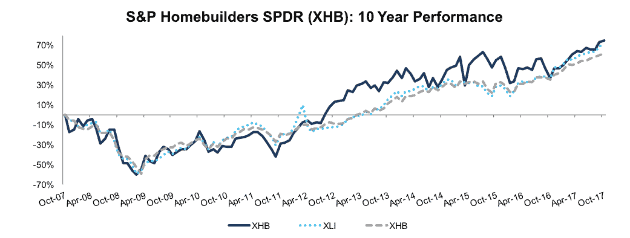
While we recognize that past performance is no guarantee of future results, XHB’s concentrated allocation of capital to the homebuilder subsector has led to significant year-to-date outperformance relative to the Industrials sector (XLI) and market (S&P). Year-to-date, XHB is up 19%, while XLI is up 15% and the S&P 500 is up 14%. XHB has also outperformed XLI and the S&P 500 over the past 10 years, as it has risen 76% compared to 71% and 62% for XLI and S&P 500 respectively. Figure 3 has more details.
The underlying fundamentals of XHB’s holdings along with the low market expectations embedded in their stock prices provide an excellent opportunity for outperformance to continue.
Figure 3: S&P Homebuilders SPDR vs. XLI & SPY
Sources: New Constructs, LLC and company filings.
The Importance of Holdings Based Fund Analysis
Investors have many options when looking to invest in Industrials sector ETFs and mutual funds. There is middle ground between a high-cost, actively managed mutual fund and the lowest cost passive ETF option. S&P Homebuilders SPDR (XHB) is among a limited group of passively-managed ETFs that justifies its fees (above the XLI benchmark) through focused asset allocation.
Diligence is required to make such informed investment decisions, and truly “passive” investors analyzing funds solely on fund labels or fees are exposing themselves to unnecessary risks by not performing diligence on fund holdings. Each quarter we rank the 11 sectors in our Sector Ratings for ETF & Mutual Funds and the 12 investment styles in our Style Ratings For ETFs & Mutual Funds report. This analysis allows us to find funds that investors using traditional fund research may overlook, such as the S&P Homebuilders SPDR.
This article originally published on October 11, 2017.
Disclosure: David Trainer, Kyle Guske II, and Kenneth James receive no compensation to write about any specific stock, style, or theme.
Follow us on Twitter, Facebook, LinkedIn, and StockTwits for real-time alerts on all our research.
[1] Ernst & Young’s recent white paper “Getting ROIC Right” proves the superiority of our stock research and analytics.
Click here to download a PDF of this report.
Photo Credit: pixabay.com (Pexels)