
Optimism created by rising earnings and the potential of corporate tax cuts dominated the markets in 2017 and helped drive the S&P 500 to a 19% gain for the year.
That optimism has faded in 2018, as concerns over tariffs and geopolitical instability have contributed to a turbulent market. By mid-February, the S&P 500 had already experienced as many days with +/-1% swings as it had in all of 2017. Analysts have been scratching their heads trying to figure out why the market keeps dropping even as companies keep beating earnings expectations.
The answer? These earnings beats aren’t real. They’re mostly a product of accounting gimmicks[1], which after being removed, reveal that the true economic earnings of the market continue to decline.
The good news is that the market’s valuation remains well below its pre-2008 levels. Barring any major negative news (e.g. an oil crisis), we expect to see a relatively flat market for the rest of 2018 as company fundamentals catch up to the gains of last year.
As for individual stocks, however, dangers lurk as fundamental diligence becomes increasingly important. Many stocks that have been propped up by momentum and accounting gimmicks over the past few years have already seen their bubbles burst. We expect that trend to accelerate in 2018. At the same time, many undervalued companies with real cash flow growth are waiting to be discovered by investors willing to look beyond unscrubbed accounting results.
GAAP Earnings Growth Isn’t Real
GAAP net income increased by 16% and hit a record high in 2017 for the 1,000 largest (by market cap) U.S. companies that we cover. As Figure 1 shows, however, that earnings growth is an illusion.
Figure 1: Economic Earnings Declining for 1000 Largest U.S. Companies
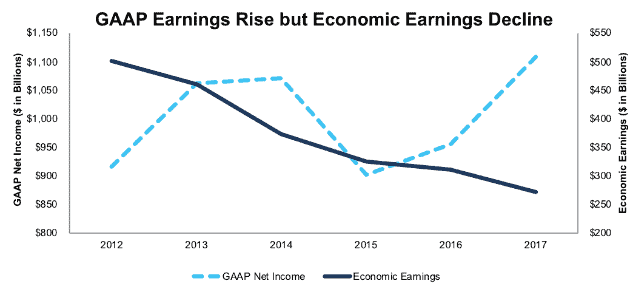
Sources: New Constructs, LLC and company filings.
Economic earnings, the true cash flows of the business, declined by 13% in 2017 and hit their lowest level since 2010.
There are two primary causes for this divergence:
- Accounting loopholes, especially related to taxes and pensions, helped accounting earnings grow at roughly double the rate of after-tax operating profit (NOPAT).
- GAAP earnings don’t capture the cost of equity capital or balance sheet growth, both of which increased significantly last year.
Closing Accounting Loopholes That Falsely Boost Income Statements
Before 4Q 2017 earnings were announced, we wrote that some companies would record big one-time gains and others would take one-time losses as the corporate tax cut decreased the value of deferred tax assets and liabilities. Since U.S. companies have more deferred tax liabilities than they do assets, the winners greatly exceeded the losers.
Our models adjust for unusual changes in taxes to better reflect their actual cash tax rate on operating profits. For 2017, we removed $50 billion more in non-operating tax gains from the 1000 largest U.S. companies than we did the year before. AT&T (T) alone recorded a one-time $20.3 billion tax gain due to the write-down of its deferred tax liabilities.
U.S. companies also recorded significant actuarial gains on their pension plans due to the strong market performance in 2017. Companies use certain methods to “smooth” the impact of market gains and losses on their pension plans, but those returns still have an impact year-to-year. Market gains helped companies record $10 billion less in (non-operating) pension expenses in 2017, which, in turn, drove GAAP earnings up by the same amount.
Combined, these two non-operating or unusual items drove a $60 billion increase in GAAP net income in 2017, or about 40% of the $150 billion aggregate increase. After closing all accounting loopholes, we found that NOPAT only grew by 7% in 2017 compared to the 16% increase in GAAP earnings.
Capturing the Costs of Bloated Balance Sheets
A true understanding of corporate performance requires analysis not only of real after-tax profits but also the amount of invested capital management employs to generate those profits. Two companies with the same income statements can have wildly different performance if the size of their balance sheets is different.
In 2017, aggregate invested capital for the 1000 largest U.S. companies increased by 4%. More significantly, their weighted average cost of capital (WACC) increased from 5.4% to 5.9%. Rising interest rates (the average 10-year treasury yield was 50 basis points higher in 2017 compared to 2016) have made capital more expensive. When the return on low-risk investments such as U.S. Treasuries rises, investors expect an even higher return on riskier investments.
While U.S. companies did increase their return on invested capital (ROIC) in 2017, that increase failed to keep pace with growing balance sheets and the cost of capital. ROIC only increased 20 bps, from 7.2% to 7.4%, compared to the 50 bps increase in WACC.
Declining Economic Earnings Put Pressure on Valuations
Investors who only look at GAAP earnings can’t see how much more expensive the market has become. The market’s P/E ratio stayed flat in 2017 at 24, as GAAP earnings and market values grew about the same. However, Figure 2 shows that the price to economic earnings (P/EE) ratio increased significantly, from 73 to 97.
Figure 2: Price to Earnings and Price to Economic Earnings Tell Different Stories
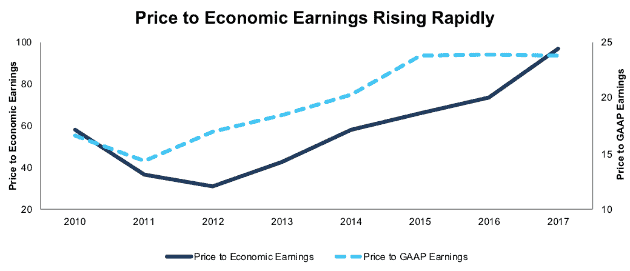
Sources: New Constructs, LLC and company filings.
The P/E ratio is flat since 2015, but P/EE has increased by 46%. Price to economic book value (PEBV), the ratio of the market value versus its zero-growth value, has similarly increased from 1.2 to 1.5. The bottom line is that market’s expectations for future profit growth have risen significantly in the past two years.
Fortunately for investors, the market’s valuation still sits well below its pre ’08 levels. In 2007, the P/EE ratio was 300, and PEBV was 1.9. Stocks are getting more expensive over the last few years, but valuations are still well below where they were prior to the last crash.
A Cause for Optimism?
Despite the trend of declining economic earnings and rising valuations, investors still have reason to be cautiously optimistic going forward. Figure 3 shows that, while rising interest rates pushed down economic earnings, the key drivers of profitability improved in 2017. NOPAT margins expanded from 10.2% to 10.4%, and average invested capital turns ticked up slightly, from 0.70 to 0.71.
Figure 3: NOPAT Margins and Invested Capital Turns Since 2010
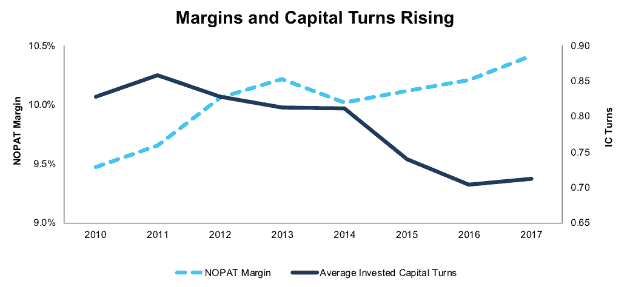
Sources: New Constructs, LLC and company filings.
Prior to 2017, capital turns hadn’t increased year over year since 2011. This trend means companies earned more revenue per dollar invested in their business in 2017. The rise in NOPAT margins means they kept a larger percentage of that revenue as profit to reinvest in the business or return to shareholders.
Even more encouragingly, the results so far from Q1 earnings season suggest that economic earnings are starting to grow again. By leveraging our Robo-Analyst technology[2], we’ve parsed over 1000 filings since mid-April, and the trailing twelve month’s economic earnings for those companies are up 1% over fiscal year 2017. This growth is still significantly slower than GAAP net income growth of 5%, but it suggests that the market’s fundamentals are, on the margin at least, improving.
These improving fundamentals, in addition to the positive impact of tax cuts on margins, should help overall profits catch up to the rise in the market’s valuation. As we saw with the tariffs earlier this year, negative shocks can still have a big impact on the market, but we believe a serious crash is unlikely in the near future.
Outside of geopolitical developments, interest rates will play a big role in the market’s direction for the rest of the year. We believe that interest rates will see a steady, but not steep, rise and remain relatively low over the long-term. A variety of economic forces are keeping the neutral interest rate – the equilibrium level at which the economy is neither stimulated nor slowed – low. Plus, no administration wants to take on the economic slowdown and political costs that accompany significantly higher rates. Dovish statements from the Fed support the idea that rate increases will slow in 2018 compared to 2017.
Overall, investors should be cautious, but not panicked. This overall market is susceptible to short-term shocks, but the long-term trend up will continue albeit at a slower pace than the past few years.
Fundamental Diligence Becoming More Important
For those investors or managers looking to outperform the indices, we see an increasing reliance on due diligence and understanding of true cash flows. Technical strategies that worked over the last several years will continue to peter out. Time to roll up the sleeves, sharpen pencils and make sure you understand fundamentals.
Momentum and low interest rates have helped many stocks that failed to pull their economic weight soar in the recent bull market. In an equity market regularly making new highs while bonds offered low yields, picking stocks was relatively easy and did not require much research.
Through 2017 and into 2018, we are seeing a more discriminating stock market, one that is punishing companies with bad economic earnings and rewarding those with good cash flows.
For example, a stock in our Focus List Short portfolio, Newell Brands (NWL), has fallen victim to this shakeout and has dropped 47% over the past year. GAAP earnings more than quadrupled in 2017, driven by a one-time tax gain, non-operating income from declining reserves, and the impact of having the Jarden acquisition on the books for the full year. On the other hand, economic earnings declined from negative $600 million to negative $1.1 billion.
NWL’s economic earnings have now declined for five consecutive years, and we expect that trend to continue. NOPAT margins and invested capital turns both declined in 2017, and the stock remains expensive with a PEBV of 4. For this reason, NWL remains in our Focus List Short portfolio as one of our highest conviction short ideas for 2018.
On the other hand, Ross Stores (ROST) stands out as a company that is generating real cash flows for investors. ROST’s economic earnings increased by 17% in 2017, which has helped drive the stock to a 25% gain over the past year.
We first featured ROST as a Long Idea last September, and it remains in our Focus List Long portfolio as one of our highest conviction long ideas for 2018. ROST’s profitability and growth should help it to thrive in a turbulent market.
On the surface, ROST and NWL look similar. They’re both Consumer Cyclicals companies with solid GAAP earnings growth and below average P/E ratios. While this surface level analysis might suffice in a momentum-driven bull market, the underlying divergent economics of the businesses cause the stocks to take divergent paths. Diligence matters…again.
This article originally published on May 9, 2018.
Disclosure: David Trainer, Sam McBride, and Kyle Guske II receive no compensation to write about any specific stock, sector, style, or theme.
Follow us on Twitter, Facebook, LinkedIn, and StockTwits for real-time alerts on all our research.
[1] Ernst & Young’s recent white paper “Getting ROIC Right” proves the superiority of our holdings research and analytics.
[2] Harvard Business School features the powerful impact of our research automation technology in the case New Constructs: Disrupting Fundamental Analysis with Robo-Analysts.
Click here to download a PDF of this report.
Photo Credit: Geralt (Pixabay)
1 Response to "Can the Market Grow Into its Valuation?"
It’s interesting article. Sam, can you show the
Q2 economic earning, so that we can see whether it increases or decreases? Thank you.