Check out this week’s Danger Zone interview with Chuck Jaffe of Money Life and Marketwatch.com
Investing themes can come and go. From mid 2014 to mid 2015, the cyber security industry was the “hot buy.” Some cyber stock prices soared anywhere from 80% to nearly 300% in this time span. Ultimately, the buzz wore off and valuations sank to lower levels. With the White House making headlines about advanced cyber security spending, this sector is back in momentum traders’ crosshairs. This week’s Danger Zone pick is up 22% this year while the S&P is up just 5%. However, the fundamentals of the business make it hard to imagine a scenario where this firm can meet the expectations baked into its lofty valuation. For these reasons and more, Palo Alto Networks (PANW: $155/share) is in the Danger Zone this week.
Revenue Growth Without The Profits To Show
Palo Alto Network’s after-tax profit (NOPAT) declined from $2 million in 2012 to -$165 million in 2016. NOPAT has fallen to -$184 million over the last twelve months (TTM).This decline in profit comes despite revenue growing 52% compounded annually from 2012-2016, per Figure 1.
Figure 1: PANW’s Profits Fall Despite Soaring Revenue
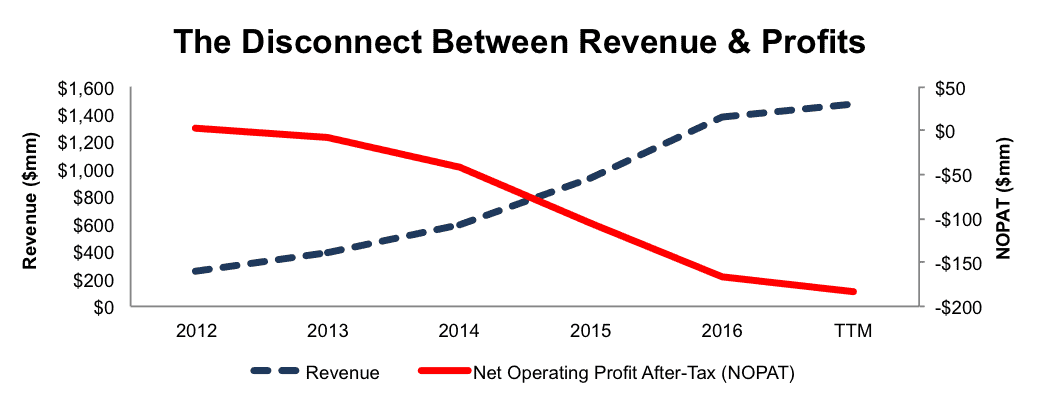
Sources: New Constructs, LLC and company filings
The issues with PANW’s business run deeper than just NOPAT. The company’s return on invested capital (ROIC) is currently a bottom-quintile -25%. Additionally, the firm has burned through a cumulative $1 billion (7% of market cap) in free cash flow over the past four years. Palo Alto’s business is faltering across many different key metrics.
Compensation Plan Misaligns Executive Interests
Palo Alto’s executive compensation plan misaligns executive interests with those of shareholders and fuels the profit losses shown above. In fact, the current compensation plan allows executives to earn large bonuses while shareholder value is destroyed.
PANW executives are eligible for base salaries, cash bonuses, and long-term equity awards. The cash bonuses are tied to the achievement of revenue and EPS goals. Management believes “revenue is a key metric during this stage of our growth and enhances long-term value creation for our stockholders.” As shown in Figure 1, revenue growth has done little to enhance the profitability of the firm.
For 2017, a performance threshold was added to Palo Alto’s long-term equity awards. The performance portion of equity awards will now be paid out based on “billings.” “Billings” represent a non-GAAP measure for revenue and further misalign executive interests with those of shareholders.
As we’ve demonstrated before, ROIC, not revenue, EPS, or “billings”, is the primary driver of shareholder value creation. Without major changes to this compensation plan (e.g. emphasizing ROIC) investors should expect further value destruction.
Non-GAAP Metrics Create Illusion of Profitability
Non-GAAP metrics often mask the true economics of a business and create the illusion of profits. Palo Alto Networks uses non-GAAP metrics such as non-GAAP net income and “billings” to “provide investors an additional tool to evaluate ongoing operating results.” However, these metrics simply make the firm look profitable when it is, in fact, losing money. Below are some of the items PANW removes to calculate its non-GAAP net income:
- Share based compensation charges
- Acquisition related charges
- Litigation related charges
These adjustments have a significant impact on the disparity between GAAP net income, non-GAAP net income, and economic earnings. In 2016 and 2015, PANW removed over $408 million (30% of revenue) and $233 million (25% of revenue) respectively in charges related to share-based compensation to calculate non-GAAP net income. When added to the other adjustments, Palo Alto reported 2016 non-GAAP net income of $153 million. Per Figure 2, GAAP net income was -$226 and economic earnings were -$216 in 2016.
Figure 2: Disconnect Between Non-GAAP & Economic Earnings
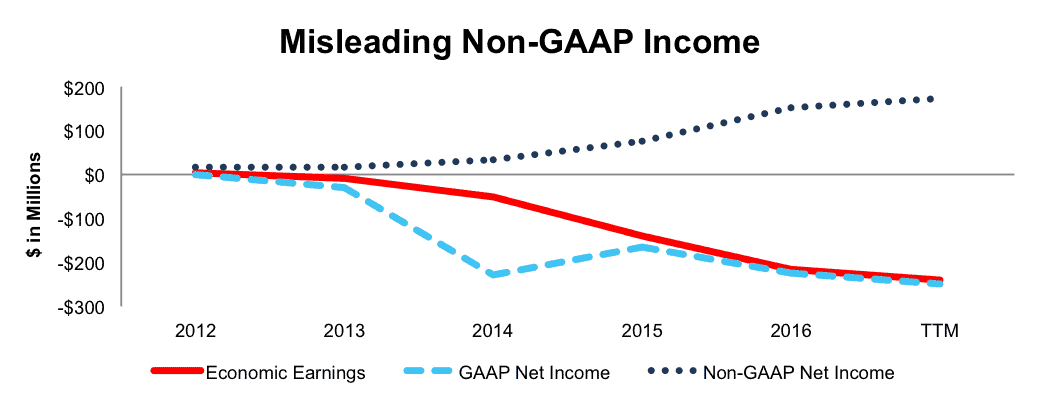
Sources: New Constructs, LLC and company filings
Negative Profitability In A Highly Competitive Market
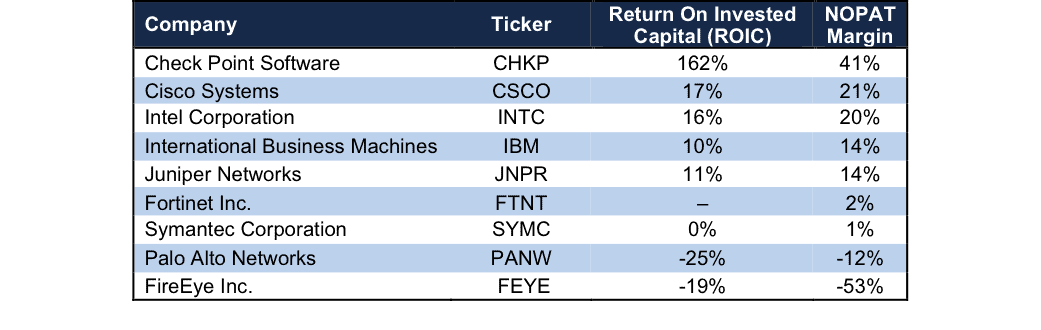
Palo Alto provides security solutions to businesses of all sizes. Its offerings include next generation firewall, endpoint protection, and cloud-based security solutions. This industry is fraught with competitors, ranging from platforms that meet one’s entire security needs to individual solutions that solve one piece of the security puzzle. Competitors include Cisco Systems (CSCO), International Business Machines (IBM), Fortinet (FTNT), Symantec (SYMC), and previous Long Idea, Check Point Software (CHKP).
The key takeaway from Figure 3 is Palo Alto Networks’ ROIC and NOPAT margin rank below nearly all competitors. The only company with lower margins than PANW is another Danger Zone pick, FireEye (FEYE), which is down 23% (S&P up 18%) since being placed in the Danger Zone. The firms with the highest profitability in the industry are those that have diversified businesses. Firms such as Cisco, Juniper Networks (JNPR), and Intel (INTC) provide security solutions in addition to business lines that are already profitable. The profits from these other business segments can be used to ensure security is a value-add to existing customers but not the main profit source of the firm. PANW doesn’t have that ability, which puts it at a competitive disadvantage.
Figure 3: Palo Alto Network’s Lack Of Profitability
 Sources: New Constructs, LLC and company filings
Bulls Ignore Negative Margins After Reaching Scale
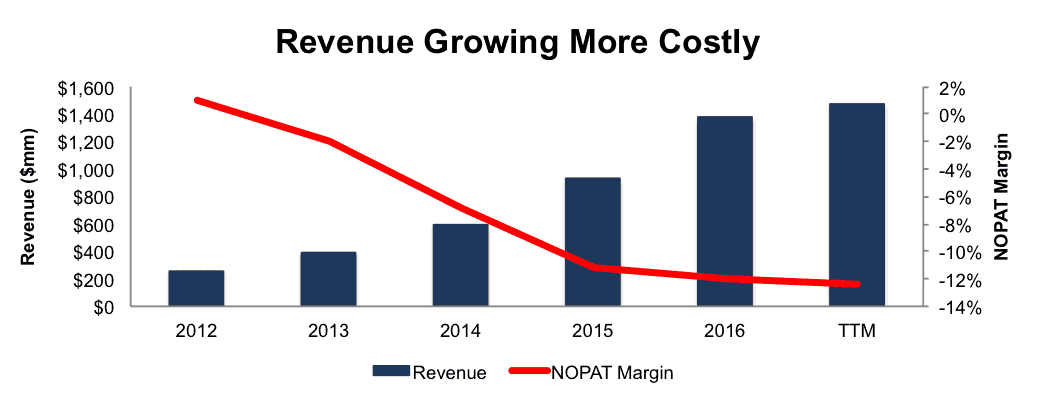
Palo Alto bulls will tout the firm’s impressive revenue growth as reason to invest in the company. This view fails to acknowledge that not only has PANW been unprofitable thus far, but revenue growth is also becoming more costly. Per Figure 4, as Palo Alto has grown revenue, its NOPAT margin has plummeted from 1% in 2012 to negative 12% TTM.
Figure 4: Growing Revenue Is Too Costly
 Sources: New Constructs, LLC and company filings.
A more detailed breakdown of the rampant cost growth can be seen in Figure 5. Palo Alto Networks’ research & development, sales & marketing, and general & administrative costs have grown 65%, 61%, and 52% compounded annually, respectively, since 2012. Over the same time, PANW’s revenue has grown 52% compounded annually.
Figure 5: PANW’s Expenses Growing Faster Than Revenue
 Sources: New Constructs, LLC and company filings
Bulls will also argue that these high costs are required to “reach scale”, but it appears Palo Alto Networks has already achieved scale with over 35,000 customers across 150 countries. For reference, FireEye has over 5,300 customers.
No matter what you think about PANW’s business, the stock’s valuation is hard to justify. The expectations already baked into the stock price imply that not only will PANW immediately reach profitability, but that it will take significant market share, as we’ll show below.
PANW Is Already Priced For Perfection
To justify its current price of $155/share, PANW must achieve NOPAT margins of 5% (average of competitors in Figure 3, compared to -12% TTM) and grow revenue by 31% compounded annually for the next 11 years. In this scenario, Palo Alto would be generating $26 billion in revenue (11 years from now), which is half of Cisco’s last fiscal year revenue and greater than Juniper, Symantec, Check Point Software, Fortinet, and FireEye’s last fiscal year revenue combined. In other words, the expectations already baked into the stock price imply Palo Alto taking significant market share while also drastically improving its profit margins.
Even if we assume PANW can achieve a 5% NOPAT margin and grow revenue by 26% compounded annually for the next decade, the stock is worth only $90/share today – a 42% downside. Each of these scenarios also assumes PANW is able to grow revenue and NOPAT/free cash flow without spending on working capital or fixed assets. This assumption is unlikely but allows us to create very optimistic scenarios that demonstrate how high expectations in the current valuation are. For reference, PANW’s invested capital has grown on average $177 million (13% of 2016 revenue) per year over the last four years.
Is PANW Worth Acquiring?
The largest risk to our bear thesis is what we call “stupid money risk”, which means an acquirer comes in and pays for PANW at the current, or higher, share price despite the stock being overvalued. We only see an acquisition as possible if an acquiring firm is willing to destroy substantial shareholder value.
Below we show just how expensive PANW remains after assuming an acquirer can gain significant synergies.
To begin, PANW has liabilities of which investors may not be aware that make it more expensive than the accounting numbers suggest.
- $376 million in off-balance-sheet operating leases (3% of market cap)
- $283 million in outstanding employee stock options (2% of market cap)
After adjusting for these liabilities we can model multiple purchase price scenarios. Even in the most optimistic of scenarios, PANW is worth less than the current share price.
Figures 6 and 7 show what we think Cisco Systems (CSCO) should pay for Palo Alto to ensure it does not destroy shareholder value. Cisco has been mentioned as a potential acquirer of security platforms with the end goal of bulking up its security offering. Acquiring PANW could quickly help achieve that goal. However, there are limits on how much CSCO would pay for PANW to earn a proper return, given the NOPAT or free cash flows being acquired.
Each implied price is based on a ‘goal ROIC’ assuming different levels of revenue growth. In each scenario, the estimated revenue growth rate in year one and two equals the consensus estimate for the current year (31%) and next year (29%). For the subsequent years, we use 29% in scenario one because it represents a continuation of next year’s expectations. We use 35% in scenario two because it assumes a merger with CSCO could create revenue growth through increased sales opportunities to existing Cisco customers.
We conservatively assume that Cisco can grow Palo Alto’s revenue and NOPAT without spending on working capital or fixed assets. We also assume Palo Alto immediately achieves a 5% NOPAT margin, which is the average of Cisco and Palo Alto’s NOPAT margin. For reference, PANW’s TTM NOPAT margin is -12%, so this assumption implies immediate improvement and allows the creation of a truly best case scenario.
Figure 6: Implied Acquisition Prices For CSCO To Achieve 6% ROIC
 Sources: New Constructs, LLC and company filings.
Figure 6 shows the ‘goal ROIC’ for CSCO as its weighted average cost of capital (WACC) or 6%. Even if Palo Alto Networks can grow revenue by 33% compounded annually with a 5% NOPAT margin for the next five years, the firm is worth less than its current price of $155/share. It’s worth noting that any deal that only achieves a 6% ROIC would be only value neutral and not accretive, as the return on the deal would equal CSCO’s WACC.
Figure 7: Implied Acquisition Prices For CSCO To Achieve 17% ROIC
 Sources: New Constructs, LLC and company filings.
Figure 7 shows the next ‘goal ROIC’ of 17%, which is Cisco’s current ROIC. Acquisitions completed at these prices would be truly accretive to CSCO shareholders. Even in the best-case growth scenario, the most CSCO should pay for PANW is $24/share (84% downside). Even assuming this best-case scenario, CSCO would destroy over $11 billion by purchasing PANW at its current valuation. Any scenario assuming less than 33% CAGR in revenue would result in further capital destruction for CSCO.
PANW Between A Rock & A Hard Place: Both Options Could Tank Shares
Palo Alto has reached a point where we see two options moving forward.
- Continue to focus on revenue growth.
- Focus on cutting costs in an effort to achieve positive margins.
However, neither approach adequately addresses the expectations already baked into the stock price. With option one, Palo Alto is able to please investors satisfied with massive revenue growth rates but will never meet profitability expectations. This approach can boost shares in the short-term, but with no profits long-term, shares could crater to a more realistic valuation.
In option two, Palo Alto achieves profitability but never grows revenue fast enough to meet the expectations ($26 billion in revenue) implied in the valuation scenario presented above. With this approach, PANW could see its valuation cut immediately, as investors would be forced to re-evaluate the firm with a focus on profits, not hyper-revenue growth.
In order to meet the expectations in PANW, the company must find a way to immediately cut costs while maintaining rapid revenue growth rates. Such a growth story (margins and revenue simultaneously) is something few, if any, firms have ever pulled off. We wouldn’t bet on Palo Alto achieving such a feat given its negative margins and tough competition.
Insider Action Is Minimal While Short Interest Is Noteworthy
Over the past 12 months, 220 thousand insider shares have been purchased and nearly 1.1 million have been sold for a net effect of 842 thousand insider shares sold. These sales represent less than 1% of shares outstanding. Additionally, there are 7.6 million shares sold short, or 8% of shares outstanding. It would appear many in the market are catching on to PANW’s overvaluation.
Impact of Footnotes Adjustments and Forensic Accounting
In order to derive the true recurring cash flows, an accurate invested capital, and a real shareholder value, we made the following adjustments to Palo Alto Network’s 2016 10-K:
Income Statement: we made $77 million of adjustments with a net effect of removing $61 million in non-operating expense (4% of revenue). We removed $8 million related to non-operating income and $69 million related to non-operating expenses. See all the adjustments made to PANW’s income statement here.
Balance Sheet: we made $2 billion of adjustments to calculate invested capital with a net decrease of $1.3 billion. The most notable adjustment was $376 million (20% of reported net assets) for operating leases. See all adjustments to PANW’s balance sheet here.
Valuation: we made $2.9 billion of adjustments with a net effect of increasing shareholder value by $563 million. The largest adjustment to shareholder value was $1.7 billion in excess cash. This adjustment represents 12% of PANW’s market cap. Despite the increase in shareholder value, PANW remains significantly overvalued as detailed above.
Dangerous Funds That Hold PANW
The following funds receive our Dangerous-or-worse rating and allocate significantly to Palo Alto Networks.
- Zevenbergen Genea Fund (ZVGIX) – 5.2% allocation and Very Dangerous rating.
- Zevenbergen Growth Fund (ZVNBX) – 4.0% allocation and Dangerous rating.
- Firsthand Funds Technology Opportunities Fund (TEFQX) – 3.7% allocation and Dangerous rating.
- RidgeWorth Innovative Growth Stock Fund (SCATX) – 3.5% allocation and Dangerous rating.
- CRM Large Cap Opportunity Fund (CRMGX) – 2.7% allocation and Very Dangerous rating.
This article originally published here on February 27, 2017.
Disclosure: David Trainer, Kyle Guske II, and Kyle Martone receive no compensation to write about any specific stock, style, or theme.
Follow us on Twitter, Facebook, LinkedIn, and StockTwits for real-time alerts on all our research.
Scottrade clients get a Free Gold Membership ($588/yr value) as well as 50% discounts and up to 20 free trades ($140 value) for signing up to Platinum, Pro or Unlimited memberships. Login or open your Scottrade account & find us under Quotes & Research/Investor Tools.
5 replies to "Danger Zone: Palo Alto Networks (PANW)"
Keep up the great work gentlemen.
PANW falls 13% after hours as revenue misses estimates in most recent earnings announcement
This was our analyst’s response to your report. I’d be curious about your response to this analysis of your analysis:
The report is using GAAP earnings as part of the NOPAT and ROIC calculations it uses to compare PANW to peers. Stock option expense is a non-cash charge. The dilutive effect is already captured in the share count. By using GAAP earnings to calculate these various metrics found in the report, you are double counting in a sense the stock option issue/penalty. You have to look at FCF in aggregate. The non-GAAP EPS excludes stock based compensation, litigation expense, and merger integration costs. The latter two, are fairly small and don’t really matter, although generally I will add these back if they are persistently being excluded by management quarter after quarter.
In effect, this report is saying that the company is not profitable. If that were indeed true, how then can the company also be growing its FCF, and FCF per share? If it were a profitless company it would throw off negative cash flow. It can’t be both. Saying that the companies non-GAAP metrics are misleading is a red herring. It’s only misleading if you don’t know and understand what’s being left out and why. If you focus on FCF then the level of stock option expense doesn’t really matter as you have a basis for evaluating the P/FCF multiple of the company that encompasses the dilution that comes option issuance. Every academic study that has looked at how the market values stocks shows that FCF is what determines stock prices and multiples, not GAAP based figures and not PE multiples, despite our overuse of them as valuation tools.
When I look at FCF for this firm I feel like they are extracting a lot of value out of the business. The growth rate is slowing, but that is to be expected as the business grows and matures. As I stated in my note, FCF is going to be growing by 30% annually for the next several years. It’s down from earlier growth rate levels, but again, too be expected. The future trajectory of FCF is what will determine the fate of the stock and based on what I know now, I still think this company can grow this metric into the future at a level that allows us to make money.
From: Stephanie Leighton
Sent: Thursday, March 02, 2017 3:03 PM
To: Jeremy Cote
Subject: RE: PANW – FYQ2 Results – Weak Guidance and Salesforce Reorg
What are your thoughts on the New Construct report I sent that shows that large net after tax / economic earnings decline in the last few years? Negative ROIC of -25%, you mentioned GM was up but this report shows a a huge decline in margin with costs up 65% CAGR vs Rev only up 52% CAGR.?.
PS Good call!
Ms. Leighton,
Thank you for your comment. I will try to address all the questions and concerns your analyst has raised above.
First of all, our report does not use GAAP earnings as part of our NOPAT and ROIC calculation. Part of our core philosophy at New Constructs is that GAAP earnings do not capture economic reality, which is why we read through the footnotes of thousands of 10-Ks to adjust GAAP net income. You can see the work we do on that front here:
https://www.newconstructs.com/category/real-earnings-season/
Our NOPAT calculation excludes unusual charges such as litigation expenses. However, we do continue to hold companies accountable for stock compensation expense, as that is a recurring expense that dilutes shareholder value. Imagine, for instance, that instead of paying employees with stock, a company sold stock to outside investors and then paid its employees with those cash flows. No one would think to exclude the compensation paid to employees in that scenario, but economically the result would be identical. When considering the profitability of any company, it does not makes sense to exclude compensation just because of the form in which it is paid.
As for PANW’s Free Cash Flow, a quick look at the cash flow statement from the most recent 10-K shows that almost the entirety of its operating cash flow (80%) came from an increase in its deferred revenue liability. That’s not true cash flow, that’s just a disconnect between the timing of payment and delivery. If PANW could keep growing revenue by ~50%/year that cash flow would be sustainable, but we’ve already seen from this most recent quarter that revenue growth is starting to slow significantly. When the company stops growing at such a rapid rate, that cash flow disappears.
Our calculation of Free Cash Flow doesn’t give companies credit for items such as changes in deferred revenue. We simply subtract the change in Invested Capital from a company’s NOPAT:
https://www.newconstructs.com/education-free-cash-flow/
By that metric, PANW had negative free cash flow of ~$240 million last year and has never earned a positive free cash flow for any year in its history. The only way PANW has been able to keep growing its cash on the balance sheet is by diluting shareholders and adding to its liabilities. That’s not a sustainable method of creating value for investors.