We closed this position on January 17, 2019. A copy of the associated Position Update report is here.
Check out this week’s Danger Zone interview with Chuck Jaffe of Money Life and Marketwatch.com
Despite significant deterioration of business fundamentals, this firm has seen its share price rise over 30% year-to-date. Investors have bought into a growth story that not only fails to produce profits, but has proven false in the past. With growing losses, significant competition, and a highly overvalued stock, Yelp Inc. (YELP: $38/share) is this week’s Danger Zone.
Revenue Growth Doesn’t Reach The Bottom Line
Yelp’s economic earnings, the true cash flows of the business, have declined from -$28 million in 2012 to -$75 million in 2015 and to -$90 million over the last twelve months (TTM). Meanwhile, revenue has grown from $138 million in 2012 to $550 million in 2015, or 59% compounded annually, and even further to $629 million TTM. See Figure 1. See the reconciliation of YELP’s GAAP net income to economic earnings here.
Figure 1: Economic Earnings Fall While Revenue Rises
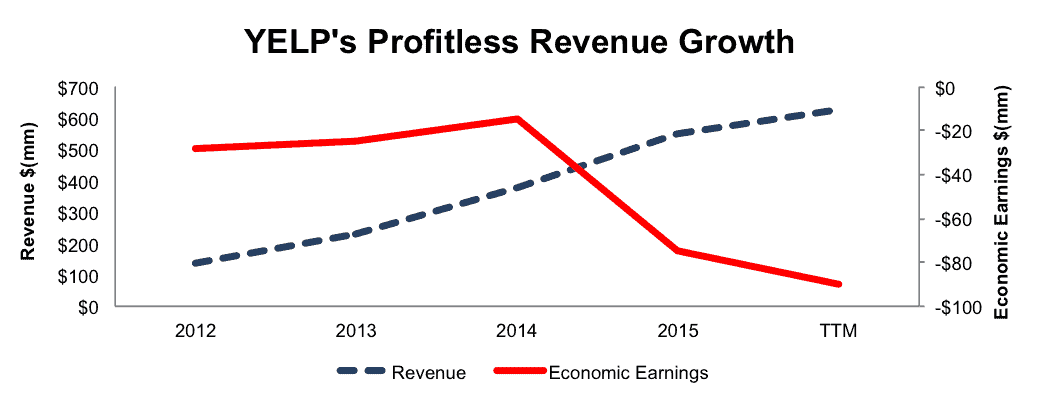
Sources: New Constructs, LLC and company filings
Yelp’s return on invested capital (ROIC) has fallen from 7% in 2014 to a bottom quintile -3% TTM. The company’s after-tax profit (NOPAT) margins have also declined from 7% in 2014 to -3% TTM. Lastly, Yelp has burned through cumulative $465 million in free cash flow since 2013.
Executive Compensation Plan Only Emphasizes Share Price
Executives at Yelp, apart from base salaries, receive short and long-term equity compensation. In some instances, such as the CEO, base salary is set at $1, and equity compensation is used instead. To bridge the gap between low salaries and the compensation of its peer group, the company uses a mix of equity awards that vest over four years, and awards that vest monthly for two years. Additionally, Yelp lists 40 separate metrics that its compensation committee can use to determine performance awards, including non-GAAP items such as bookings, billings, or user satisfaction. Yelp also lays out specific adjustments than can be made when determining performance goals such as excluding restructuring charges or the effects of stock based compensation.
With such a large portion of executive compensation tied to Yelp’s stock price, and monthly vesting schedules in some cases, management must consistently meet the market’s expectations to ensure they get paid. The “pressure to perform” could lead to exploiting accounting loopholes to manipulate earnings, which is more prevalent than most investors realize. Just as bad, acquisitions with terrible economics can grow EPS per the high-low fallacy. Lastly, incentives focused only on share price can lead to decisions that maximize short-term gains at the expense of long-term, sustainable cash flows, something we’ve witnessed before.
Ideally, all executives would be incentivized through ROIC. ROIC is the best way to create shareholder value and align executives with the best interest of shareholders because there is a clear correlation between ROIC and shareholder value.
Non-GAAP’s Positive Story Amidst Negative Economic Earnings
Companies with significant losses can use non-GAAP metrics in an attempt to paint the business in a more positive light. Yelp’s use of adjusted EBITDA and non-GAAP net income perfectly illustrates the dangers of non-GAAP metrics. Here are some of the expenses YELP has removed when calculating its non-GAAP metrics:
- Stock based compensation
- Amortization of intangible assets
- Restructuring and integration
The removal of these costs allows Yelp to report growth in non-GAAP metrics despite economic earnings heading the opposite direction. In 2015, Yelp removed nearly $61 million in stock based compensation (11% of revenue), among other expenses, to turn a $33 million GAAP loss into a $29 million non-GAAP profit. In 2014, Yelp removed $42 million in stock based compensation, which was 116% of GAAP net income. Since 2013, Yelp’s adjusted EBITDA has grown from $29 million to $71 million TTM. Meanwhile, economic earnings declined from -$25 million to -$90 million over the same time and free cash flow has remained negative and sits at -$36 million TTM, per Figure 2
Figure 2: YELP’s Misleading Non-GAAP Metric
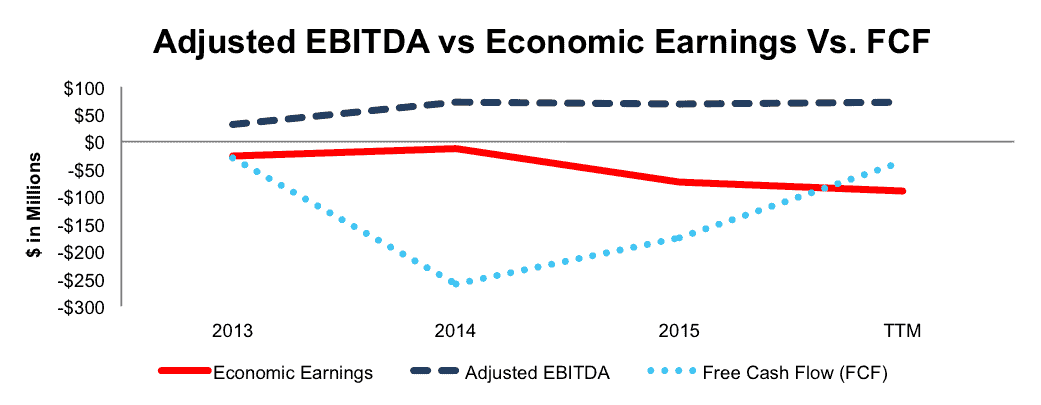
Sources: New Constructs, LLC and company filings
Yelp’s Negative Profitability Lags In A Largely Undifferentiated Market
Yelp’s primary business is based around collecting advertising revenue from businesses. From a consumer perspective, Yelp’s service provides ways to discover new businesses as well as reviews of said businesses. Its ancillary services allow for reservations, food ordering/delivery, and quote requests from service businesses. Unfortunately for Yelp, it faces competition from every angle. Figure 3 lists many different competitors and how they stack up to Yelp. From reviews, to restaurants, to overall business listings, its clear that Yelp operates in a highly competitive market. Remove Yelp from the market, and any of the firms below would fill the void.
We do not think that being a digital version of the yellow pages makes Yelp’s business meaningfully stronger than the offline version of yellow pages. As we have stated about Netflix (NFLX), there is no sustainable value creation in businesses that are built around leveraging the Internet to deliver content. Just doing something over the Internet does not, by itself, create a viable business especially when it comes to content. The value, as it always has been, is in high quality original content. Consequently, we see Yelp as an undifferentiated distributor of commoditized content that will follow a similar lifecycle to the offline yellow pages.
Figure 3: Yelp Vs. Competition
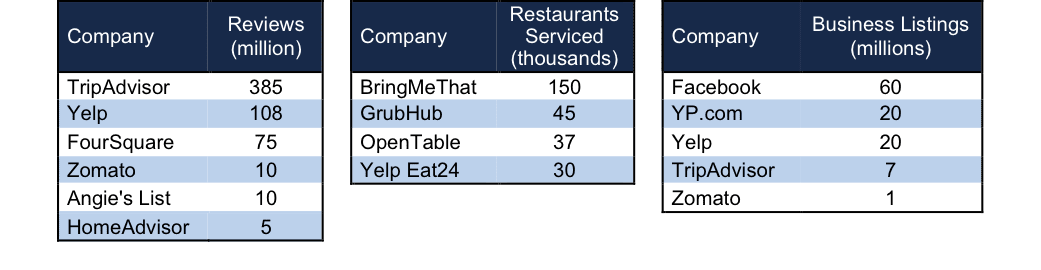
Sources: New Constructs, LLC and company filings
Though many of these competitors focus on one subset of a market, or one service type (e.g. restaurants), this list, which includes firms such as Facebook (FB), Grub Hub (GRUB), TripAdvisor (TRIP), and Angie’s List (ANGI) is by no means exhaustive. Alphabet (GOOGL) remains a large competitor, with its search business and its own reviews. Additionally, local radio and newspaper outlets, not to mention firms not listed above, such as the Better Business Bureau, Thumbtack, Zagat or even Airbnb, whose city “guidebooks” contain local recommendations from travelers, further crowd the market.
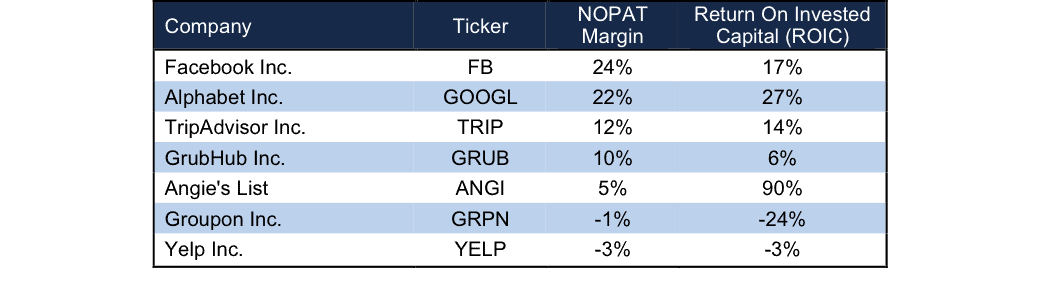
Yelp’s quest to be a one-stop shop has left its profitability lagging the competition. Per Figure 4, Yelp’s NOPAT margin ranks well below advertising giants Facebook and Google, but also below firms such as TripAdvisor (TRIP) and GrubHub (GRUB). In a largely commoditized market, Yelp has little pricing power, an issue exacerbated by its already negative margins.
Figure 4: Yelp’s Negative Profitability
Sources: New Constructs, LLC and company filings
Bull Hopes Ignores Slowing User Growth As Offering Is Increasingly Commoditized
Trying to be all things to all people with respect to connecting consumers with businesses through search, reviews, and advertising has stretched the company’s operations thin and led to cash losses. Yelp does not appear to have staked a leadership position in any category. Nevertheless, bulls have overlooked the cash losses and weak competitive position and seem to be drinking the non-GAAP profit and revenue growth koolaid in the first two quarters of this year.
At some point, investors will be in for a bad surprise as costs have grown at an equal or greater pace than revenues. Since 2012, Yelp’s cost of revenue has grown 73% compounded annually. Its sales & marketing expenses have grown 52% compounded annually while product development and general & administrative costs have grown 74% and 37% compounded annually respectively. In order to grow the top line, Yelp has aggressively spent on sales and product development, all while accumulating greater losses.
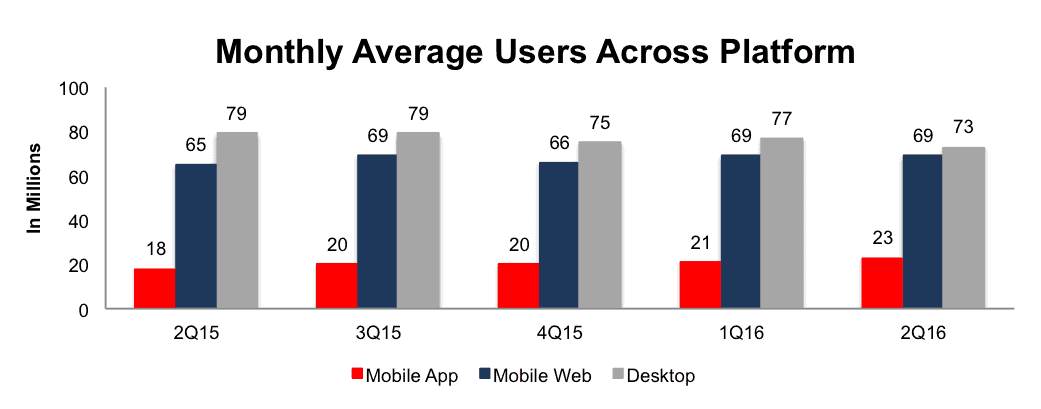
All this spending should equate to Yelp having a large network of businesses paying for ads, and a large user base that can make the ads worthwhile. However, Yelp’s user growth is not only slowing, but actually declining in some areas, per Figure 5.
Figure 5: Yelp’s Monthly Average Users
Sources: New Constructs, LLC and company filings
Yelp’s monthly average users of its mobile app grew 39% year over year in 3Q15. In 2Q16, that user growth had slowed to 27%. The company’s monthly average mobile site users were 69 million in 3Q15 and have largely stagnated since. Not surprising, as consumers move away from traditional desktop computers, the company’s monthly average desktop users have declined from 79 million in 3Q15 to 73 million in 2Q16.
Meanwhile per Figure 6, Facebook has reported 1.7 billion monthly active users, Google has over 1 billion monthly active users, and TripAdvisor reports 350 million monthly active users. Compared to Yelp, which had 165 million monthly active users in 2Q16, Yelp’s user base pales in comparison.
Figure 6: Monthly Active Users Across Service

Sources: New Constructs, LLC and company filings or press releases
*Google’s Search, Android, Maps, Chrome, YouTube, Google Play and Gmail each have over one billion monthly active users.
*Yelp users consist of monthly app users, monthly mobile web users, and monthly desktop users combined
*YP.com users consist of app users and web users combined
*OpenTable states it seats 20 million diners per month
Lastly, an issue that never seems to disappear when it relates to Yelp is the legitimacy of their reviews. We saw a similar issue when we analyzed Angie’s List as well. There are numerous complaints that reviews are fake, inaccurate, or selectively filtered in a way that misrepresents a business. Additionally, there have been complaints of Yelp removing positive reviews when companies fail to pay for advertising, a claim Yelp has denied, yet allegations continue to arise. Whether these complaints are true or not, the legitimacy of Yelp’s reviews is at the core of its service, which means anytime issues make the news, businesses may turn away from the service.
Looking past the exorbitant costs, the slowing user growth, and questions over legitimate reviews, the largest risk to the bear case is what we call “stupid money risk”, which is higher in today’s low growth (organic) environment. Another firm could acquire YELP at a value that is much higher than the current market price. As we’ll show below, such an acquisition would not be a wise move at current prices.
YELP Investors Hoping For A Buyout?
The biggest risk to our thesis is that an outside firm acquires YELP at a value at or above today’s price. Despite the negative profitability and ample competition, Yelp’s review database could provide value in an acquisition. From 2012 to 2015, Yelp’s review database grew from 36 million to 95 million. In the first two quarters of 2016, total reviews have grown to 108 million. To build out a similar database, it would take significant time and resources. However, after increasing over 30% YTD, YELP is much more costly to any potential acquirer, and any buyout hope may have passed. In fact, we’ll show below that YELP is not an attractive acquisition target unless a buyer is willing to destroy significant shareholder value.
To begin, YELP has liabilities of which investors may not be aware that make it more expensive than the accounting numbers suggest.
- $270 million in off-balance-sheet operating leases (9% of market cap)
- $201 million in outstanding employee stock options (7% of market cap)
After adjusting for these liabilities we can model multiple purchase price scenarios. Even in the most optimistic of scenarios, YELP is worth less than the current share price.
Figures 7 and 8 show what we think Alphabet (GOOGL) should pay for YELP to ensure it does not destroy shareholder value. Alphabet, through Google, already provides advertising to businesses and provides reviews through Google reviews. One could make the case that acquiring Yelp would eliminate competition within the review and advertising space and create a greater user base with which businesses could promote to. However, acquiring Yelp could mean significant cross over in users of the two search services, leaving the value in Yelp’s review database. Regardless, there are limits on how much GOOGL would pay for YELP to earn a proper return, given the NOPAT or free cash flows being acquired.
Each implied price is based on a ‘goal ROIC’ assuming different levels of revenue growth. In each scenario, the estimated revenue growth rate in year one equals the consensus estimate for 2016 (29%). For the subsequent years, we use 25% in scenario one because it represents a continuation of 2017 expectations. We use 30% in scenario two under the assumption that a merger with Alphabet would create additional revenue opportunities.
We conservatively assume that Alphabet can grow YELP’s revenue and NOPAT without spending on working capital or fixed assets. We also assume YELP achieves a 9% NOPAT margin, which is the average of Alphabet and Yelp’s current NOPAT margins. For reference, YELP’s TTM NOPAT margin is -3%, so this assumption implies drastic and immediate improvement, but creates a truly best case scenario.
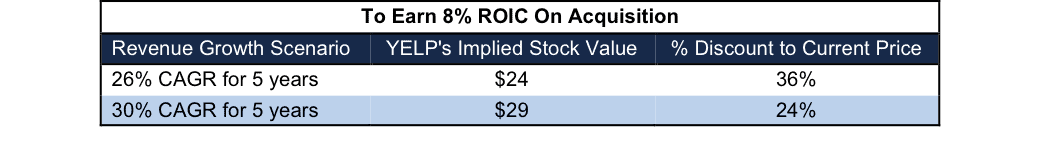
Figure 7: Implied Acquisition Prices For GOOGL To Achieve 8% ROIC
Sources: New Constructs, LLC and company filings.
Figure 7 shows the ‘goal ROIC’ for GOOGL as its weighted average cost of capital (WACC) or 8%. Even if Yelp can grow revenue by 30% compounded annually with a 9% NOPAT margin for the next five years, the firm is not worth more than its current price of $38/share. Assuming the 30% scenario is a best-case view, Alphabet would destroy over $800 million by purchasing YELP at its current valuation. It’s also worth noting that any deal that only achieves an 8% ROIC would be only value neutral and not accretive, as the return on the deal would equal GOOGL’s WACC.
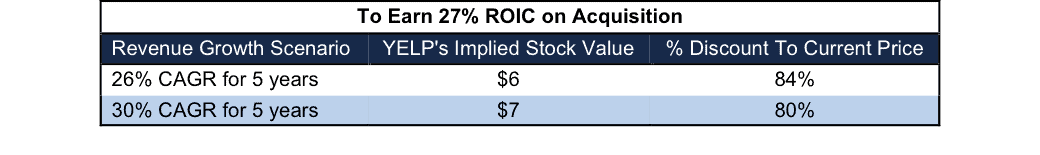
Figure 8: Implied Acquisition Prices For GOOGL To Achieve 27% ROIC
Sources: New Constructs, LLC and company filings.
Figure 8 shows the next ‘goal ROIC’ of 27%, which is GOOGL’s current ROIC. Acquisitions completed at these prices would be truly accretive to GOOGL shareholders. Even in the best-case growth scenario, the most Alphabet should pay for YELP is $7/share (80% downside). Assuming this best-case scenario, Alphabet would destroy nearly $2.5 billion by purchasing YELP at its current valuation. Any scenario below 30% CAGR would result in further capital destruction. Furthermore, any deal above $7/share would lower GOOGL’s ROIC, thereby destroying shareholder value.
On Its Own, YELP Is Overvalued
YELP is up over 30% YTD, despite cash flows becoming increasingly more negative, as seen in Figure 1. Such price appreciation amidst declining fundamentals leaves YELP significantly overvalued. To justify the current price of $38/share, YELP must achieve 6.6% pretax margins (highest ever achieved in 2014, compared to -3% TTM) and grow revenue by 23% compounded annually for the next 14 years. In this scenario, YELP would be generating over $10 billion in revenue 14 years from now, which is greater than Mastercard’s (MA) 2015 revenue and more than three times greater than Groupon’s 2015 revenue.
Even if we assume YELP can achieve 6.6% pretax margins and grow revenue by 18% compounded annually for the next decade, the stock is only worth $15/share today – a 60% downside.
Each of these scenarios also assumes the company is able to grow revenue and NOPAT without spending on working capital or fixed assets, an assumption that is unlikely, but allows us to create a very optimistic scenario. For reference, YELP’s invested capital has grown on average $160 million (29% of 2015 revenue) each year since 2012.
Catalyst: YELP Faces Same Risks That Tanked Shares Before
YELP has proven to be quite the volatile stock, once trading near $100/share in early 2014. We’ve seen this boom/bust cycle play out at Yelp multiple times, and if history is anything to go by, the story doesn’t end well. Shares of YELP have been punished for three distinct reasons in the past.
- Yelp reported slowing user growth in 3Q14,
- Below expectation sales in 1Q15, and
- Heavy spending that diminished margins in 4Q15.
Despite user growth remaining questionable (and slowing), the firm’s TTM margins in decline over 2015, and continued heavy spending, investors have chosen to overlook the issues that not only caused shares to drop in the past, but still remain prevalent.
As shown above, even in the most optimistic scenarios, the profit growth already baked into YELP remains highly optimistic.
With a captive user base that it is unable to monetize enough to break even, Yelp has two choices:
- If Yelp chooses to continue it’s high revenue growth strategy, it must continue sacrificing margins to grow the top line.
- If Yelp abandons the revenue growth strategy and settles into a smaller provider that operates profitably, it cannot achieve the lofty profit growth expectations currently embedded into its stock price.
In scenario one, the company accrues even greater losses. In scenario two, the company ends the “growth story” that investors have bought into during the first half of 2016. Momentum stocks can be great short term trades when they’re on the upswing, but when the fundamentals are revealed, and true value investors see through the unprofitable growth story, the results can be damaging.
Insider Action Is Low While Short Interest Is High
Over the past 12 months 1.5 million insider shares have been purchased and 310 thousand have been sold for a net effect of 1.2 million insider shares purchased. These purchases represent just under 2% of shares outstanding. Additionally, there are 7.5 million shares sold short, or just under 10% of shares outstanding.
Impact of Footnotes Adjustments and Forensic Accounting
In order to derive the true recurring cash flows, an accurate invested capital, and a real shareholder value, we made the following adjustments to Yelp’s 2015 10-K:
Income Statement: we made $28 million of adjustments with a net effect of removing $26 million in non-operating expenses (5% of revenue). We removed $27 million related to non-operating expenses and $1 million related to non-operating income. See all adjustments made to YELP’s income statement here.
Balance Sheet: we made $651 million of adjustments to calculate invested capital with a net decrease of $81 million. The most notable adjustment was $270 million (38% of net assets) related to operating leases. See all adjustments to YELP’s balance sheet here.
Valuation: we made $844 million of adjustments with a net effect of decreasing shareholder value by $98 million. One of the notable adjustments was $201 million related to outstanding employee stock options. This adjustment represents 10% of Yelp’s market cap.
Dangerous Funds That Hold YELP
The following funds receive our Dangerous-or-worse rating and allocate significantly to Yelp.
- Delaware Smid Cap Growth Fund (DFCIX) – 1.8% allocation and Dangerous rating.
- TCW Small Cap Growth Fund (TGSNX) – 1.7% allocation and Very Dangerous rating.
This article originally published here on August 22, 2016.
Disclosure: David Trainer and Kyle Guske II receive no compensation to write about any specific stock, style, or theme.
2 replies to "Danger Zone: Yelp Inc. (YELP)"
Yelp falls 12% as 2017 guidance fails to meet consensus expectations.
YELP falls 18% as company lowers yearly outlook. Now down 24% since our original Danger Zone report.