We closed the ZG position on June 29, 2021. A copy of the associated Position Update report is here.
Check out this week’s Danger Zone interview with Chuck Jaffe of Money Life and Marketwatch.com
We know that CFO’s admit to manipulating earnings. We also know that non-GAAP metrics can be misleading. What continues to surprise us, though, is the magnitude of difference between non-GAAP earnings and true economic earnings. This week’s Danger Zone pick, Zillow Group (ZG: $24/share), sounds multiple alarms: unusually misleading non-GAAP earnings, overvalued stock and broken business model.
Ignore Non-GAAP Earnings
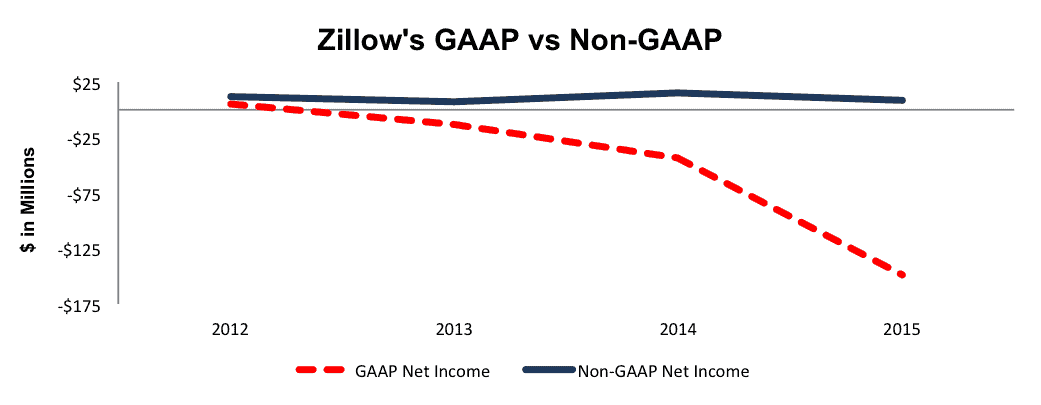
It’s quite obvious that Zillow fails to make any money. Since 2011, the company’s GAAP net income has declined from $1 million to -$149 million. However, Zillow management would prefer investors focus on other numbers, i.e. non-GAAP net income, as it “better represents the business.” It should come as no surprise that Zillow’s non-GAAP net income has been positive each year since going public and was $8 million in 2015, well above the $149 million loss under GAAP accounting. Figure 1 has the details.
Figure 1: Large Discrepancy Between GAAP & Non-GAAP Income
Sources: New Constructs, LLC and company filings
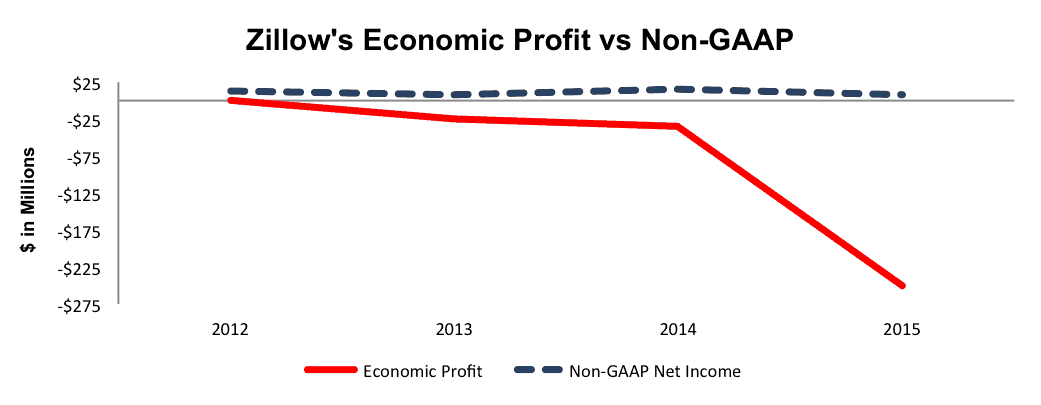
The disconnect in profits doesn’t stop there. When we calculate economic earnings, we find that since 2011, Zillow’s economic profits have declined from $3 million to -$250 million. The misleading nature of Zillow’s non-GAAP earnings can be seen in Figure 2 below.
Figure 2: Even Larger Discrepancy Between Economic Profit & Non-GAAP
Sources: New Constructs, LLC and company filings
Management’s non-GAAP metrics remove many standard costs of doing business, such as:
- Equity-based compensation, which Zillow uses throughout the company, not just executives.
- Acquisition costs, despite acquisitions being a primary driver of revenue throughout Zillow’s history.
- Restructuring costs, which stem from Zillow’s acquisitions.
In 2015, Zillow removed $105 million in equity-based compensation costs (16% of revenue), $16 million in acquisition costs (2% of revenue), and $35 million in restructuring costs (5% of revenue).
Business Model Is Upside Down – Costs Growing Faster Than Revenue
Since going public in 2011, the company has taken on a grow-at-all-costs mentality. This approach has been excellent for growing the top line, (77% compounded annual growth since 2011), but it would appear costs have been completely ignored. Over this same timeframe, sales & marketing costs have soared 86% compounded annually while R&D costs have grown 94% compounded annually. General & administrative costs have increased 85% compounded annually.
These runaway costs have come on the heels of numerous acquisitions that have failed to improve Zillow’s profitability, as shown by the company’s declining return on invested capital (ROIC). Zillow’s ROIC has fallen from a once impressive 13% in 2011 to -2% in 2015. We’ve shown that a decline in ROIC is bad for valuation.
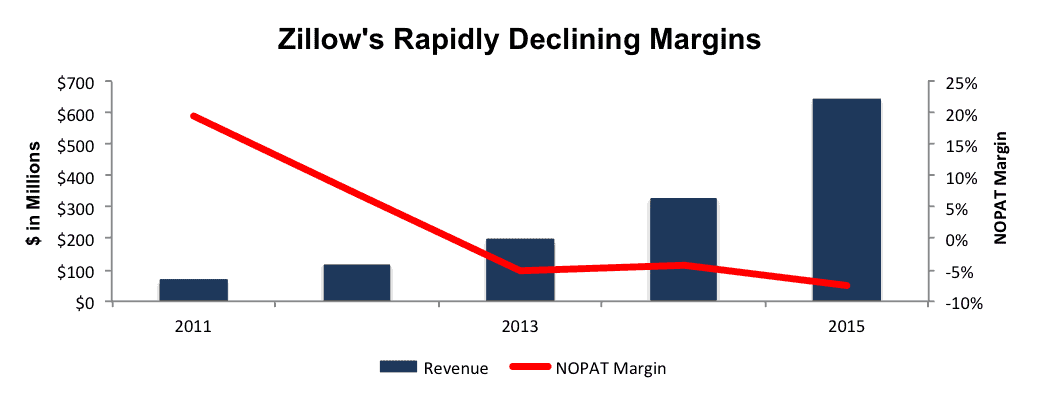
Zillow’s NOPAT margins have seen a similar decline and fallen from 20% in 2011 to -8% in 2015. What was once a profitable business has done a complete 180 in an effort to meet the lofty revenue growth expectations of a growing startup company. Figure 3 below has more details.
Figure 3: Revenue Growth At Cost of Margins
Sources: New Constructs, LLC and company filings
Zillow’s Data Quality Suffers Compared to Competitors
To get real estate information, buyers can:
- work directly with an agent,
- visit local broker sites, or
- visit listing sites such as
- zillow.com, recently acquired Trulia.com (an acquisition we analyzed at the time),
- realtor.com, or
- redfin.com.
The quality and utility of these services to users, for the most part, depends on the quality of the data they provide, which is driven by how the sites collect and verify listing data.
By far, the best source for real estate information is the multiple listing service (MLS) sites. MLSs are the original source data of home listings shared between brokers, only accessible by real estate agents, and updated in real time by agents. As the official site of the National Association of Realtors, realtor.com receives listing data from more than 800 MLSs, data which is used to populate its consumer facing home listing service. Realtor.com’s listings cover more than 97% of all MLS listed for sale properties. Because Redfin is a broker, it is also able to access MLSs to secure data for its listing website.
The key difference between these two sites and Zillow is the MLS access. Because Zillow is not a broker, it is not able to broadly access MLSs. Instead, it has to secure deals with individual MLSs to receive data feeds. At the end of 2015, Zillow had deals with only 400 out of over 800 MLSs. When deals cannot be made, Zillow relies upon individual agents sharing their listings with Zillow, either manually or through Internet data exchanges, publically available information, or syndication partners.
This data collection model puts Zillow at a competitive disadvantage to Redfin and realtor.com. First, it is more expensive, complicated, and difficult to maintain as Zillow has to make, manage, and integrate separate agreements with multiple data providers. The worst part, however, is that Zillow’s data collection model relies on incomplete and/or lower quality data that has errors that can mislead its users.
For, example, as far back as 2012, it was found that Zillow displayed 20% less listings than real estate brokerage sites. In 2013, Zip Realty argued that Zillow only contained 73% of listings that were on MLSs and that 16% of Zillow’s listings had already been sold or were out of date. More recently, in February 2015, the L.A. Times reported that Zillow’s localized price estimate error rates far exceed the national average. These reports are the natural and inevitable results of Zillow not having all the necessary data to properly estimate an accurate value for a home. Later, in October 2015, ComScore noted that despite being the leader in web traffic, Zillow/Trulia lists far fewer properties than realtor.com, upwards of 60% less depending upon the city analyzed. While Zillow can buy its way to the top of the web traffic ratings, i.e. the Trulia purchase, if it consistently integrates poor or incorrect data, users will look elsewhere.
Bull Case Implies Ignores Business Flaws
Zillow bulls believe in the company because of its large market share. Unfortunately, the large market share does not translate into profits. Quite the opposite, as noted above, Zillow is experiencing major cash losses. Often, we hear that once a company “reaches scale” they will become profitable. In the case of Zillow, the opposite is happening. As the company has acquired competitors, expanded its market share, and effectively reached scale, it has only become less profitable with each passing year.
Zillow reminds us of the problems we saw in the case of Groupon (GRPN), another Danger Zone stock. Zillow doesn’t own the “key ingredients.” It is a middle man selling someone else’s commoditized data. We do not see how it can ever make money when it offers no advantage to its users. We do not think the company has any pricing power as long as it has competitors, who have better data, because users can simply go to another site to get the same or, even, better data. Without pricing power, we do not see how the firm can raise prices enough to ever make enough money to justify the dangerously high expectations baked into its current stock price.
ZG Is Significantly Overvalued, Even In Buyout Scenario
Since Zillow is estimated to have upwards of 49% of the online real estate market, as measured by website traffic, it seems unlikely that a competitor would choose to acquire the firm. Odds are better that Zillow will continue upon its acquisition strategy to keep revenue growing, though that strategy is running out of stream as there are not as many players left to buy.
Nevertheless, a situation could arise where an Internet giant, say Alphabet (GOOGL), decides that Zillow would be worth buying. In any acquisition scenario, investors should note that Zillow has hidden liabilities that make it more expensive than the accounting numbers suggest.
- $148 million in off-balance-sheet operating leases (3% of market cap)
- $254 million in outstanding employee stock options (6% of market cap)
Even looking past these hidden liabilities, Zillow doesn’t represent an attractive acquisition target. If we assume that ZG immediately achieves Alphabet’s margins, Zillow would still have to grow revenue by 20% compounded annually for six years to justify purchase at its current stock price. A more realistic price Alphabet should pay is $15/share (40% downside from current share price), which is the value of Zillow’s business based on the value of the firm if it achieves Alphabet’s 21% NOPAT margin in year one of the acquisition.
On its own, if Zillow can immediately achieve 5% pretax margins (-8% in 2015) and grow revenue by 20% compounded annually for the next decade, the stock is worth only $7/share today – a 71% downside.
Catalysts Could Drop ZG: Real Estate Market Slow Down and Huge Stockholder Dilution
We think this stock is highly susceptible to a big drop in price like what we have recently seen from other Danger Zone picks like LinkedIn (LNKD) and Twitter (TWTR) if the company cannot maintain its torrid revenue growth. We think revenue growth is likely to decline for two key reasons:
- Acquisitions dry up. Since Zillow already garners nearly 50% of web traffic in its industry, meaningful acquisitions are more difficult to come by. Can Zillow continue breakneck revenue growth rates when acquisitions disappear? Are there even acquisitions that can keep Zillow growing given its already large market share?
- Housing market slows. As we showed last year, when we put KB Homes (KBH) in the Danger Zone, the housing market looks to be peaking, which could mean that Zillow’s business will no longer be propelled by the strong secular upswing in housing enjoyed over the last few years. Zillow provided revenue guidance for 1Q16 that came in slightly below analyst expectations, and that trend will likely continue if housing slows.
Two other potential catalysts:
- Investors tire of Zillow’s continual shareholder dilution. To pay for any more meaningfully-sized acquisitions, investors would see more dilution, just as we saw when Zillow acquired Trulia. Since 2013, Zillow’s shares outstanding have increased from 33 million to 118 million, a compounded annual growth of 89%.
- Lastly, investors may tire of the Zillow story and start focusing on its profits and the hard-to-believe expectations for future profits baked into its stock price.
Beware Wall Street Ratings And Conflicts Of Interest
Companies selling as many shares as Zillow are prized Wall Street clients. Firms selling stock rarely see any negative ratings from Wall Street because those firms want their business. Not surprising, Goldman Sachs (GS), who ran book on the 2013 secondary offering and advised Zillow on its Trulia acquisition has a Buy rating on the company. Per Nasdaq.com, Zillow receives three buy ratings, eight hold ratings, and only two sell ratings. Potential dilution can be a boon for Wall Street firms, but existing shareholders may decide enough is enough and dump shares en masse.
Insider Buying Sent Shares Soaring But Short Interest Remains Low
Over the past 12 months 2.3 million shares have been purchased and 198 thousand shares have been sold for a net effect of 2.1 million insider shares purchased. These purchases represent 2% of shares outstanding. These purchase have aided the stock’s over nearly 25% increase over the past month, which only makes shares more overvalued. Additionally, there are 10.8 million shares sold short, or 9% of shares outstanding.
Executive Compensation Lacks Measurables
At Zillow, executives receive standard salaries and, with the exception of Greg Schwartz, Chief Revenue Officer, do not have a formal plan for receiving cash bonuses. Mr. Schwartz is eligible for incentive cash bonuses based upon Zillow achieving target revenue goals. Throughout the company, not just at the executive level, Zillow uses equity-based compensation to attract talent and pay employees. Unfortunately there is no formal plan for the issuance of this equity-based pay, either. Instead, equity-based compensation is determined based upon the role of the executive, the market for the executive’s position, and a subjective evaluation of individual performance.
With no measurable goals for receiving these equity-based payments, which as we saw above are soaring at a significant rate, it becomes awfully difficult to justify Zillow’s executives receiving over $25 million in equity-based compensation over the past three years. Perhaps if Zillow were to adopt a plan that focuses on metrics proven to create shareholder value, such as ROIC, it would become easier to judge the merits of executive bonuses.
Impact of Footnotes Adjustments and Forensic Accounting
In order to derive the true recurring cash flows, an accurate invested capital, and a real shareholder value, we made the following adjustments to Zillow’s 2015 10-K:
Income Statement: we made $103 million of adjustments with a net effect of removing $100 million in non-operating expenses (15% of revenue). We removed $100 million related to non-operating expenses, including $27 million in litigation costs that were hidden in operating earnings. Despite removing such large expenses, Zillow’s NOPAT still declined year over year in 2015.
Balance Sheet: we made $1 billion of adjustments to calculate invested capital with a net decrease of $714 million. The most notable adjustment was $360 million (12% of net assets) related to midyear acquisitions.
Valuation: we made $1.2 billion of shareholder value adjustments with a net decrease of $187 million. The most notable adjustment was the removal of $254 million (6% of market cap) related to the value of outstanding employee stock options.
Dangerous Funds That Hold ZG
The following fund receives our Dangerous rating and allocates significantly to Zillow Group.
- Baron Partners Fund (BPTRX) – 1.5% allocation and Dangerous rating.
- RidgeWorth Aggressive Growth Stock Fund (SAGAX) – 1.3% allocation and Very Dangerous rating.
Disclosure: David Trainer and Kyle Guske II receive no compensation to write about any specific stock, style, or theme.
Click here to download a PDF of this report.
Photo Credit: investorplace


