
Check out this week’s Danger Zone interview with Chuck Jaffe of Money Life.
Over the long-run, mid cap stocks have outperformed the market and many investors have earned great returns allocating to these stocks. However, blindly allocating to mid cap stocks is no winning strategy. Through our rigorous analysis of fund holdings[1], we’ve identified a mutual fund whose past performance looks great, but current holdings reveal significant downside risk. Delaware Smid Cap Growth Fund (DFCIX) is in the Danger Zone.
Backwards Looking Research Overrates This Fund
Investors that rely solely on past performance may miss the biggest risk of investing in this fund. Per Figure 1, all of the share classes of Delaware Smid Cap Growth Fund earn the 5-Star rating from Morningstar while garnering our Very Unattractive rating, the worst of our Predictive Risk/Reward Fund ratings.
Figure 1: Delaware Smid Cap Growth Fund Ratings

Sources: New Constructs, LLC, company, ETF and mutual fund filings, and Morningstar
DFCIX allocates significantly more capital to companies with low profitability and high profit growth expectations baked into their stock prices, which makes its portfolio riskier than its benchmark, iShares Russell Mid Cap Growth ETF (IWP), and the S&P 500 (SPY).
Holdings Research Reveals a Low-Quality Portfolio
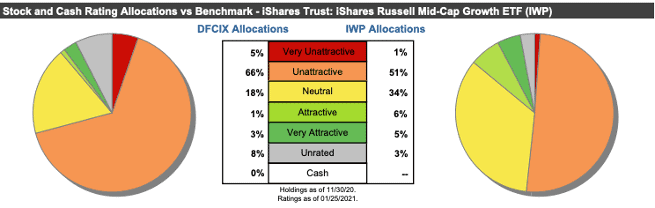
Per Figure 2, Delaware Smid Cap Growth Fund’s asset allocation poses greater downside risk and holds less upside potential than IWP.
DFCIX allocates 71% of its portfolio to Unattractive-or-worse rated stocks compared to just 51% for IWP. On the flip side, DFCIX’s exposure to Attractive-or-better rated stocks is much lower, at 4%, versus IWP at 11%.
Additionally, 35% of the fund’s holdings are allocated to seven of DFCIX’s top 9[2] holdings which earn a Neutral-or-worse rating.
Figure 2: DFCIX Allocates Capital to More Low-Quality Holdings
Sources: New Constructs, LLC and company, ETF and mutual fund filings
Given the unfavorable allocation of Attractive-or-better rated stocks vs. Unattractive-or-worse rated stocks relative to the benchmark, DFCIX appears poorly positioned to generate the outperformance required going forward to justify its fees.
Investors don’t have to pay for such low-quality asset allocation anymore either. As we showed in The Paradigm Shift to Self-Directed Portfolio Construction, new technologies enable investors to create their own fund without any fees while also enabling better, more sophisticated weighting methodologies. If instead of weighting by DFCIX’s method, we weight the fund’s holdings by return on invested capital (ROIC), a key driver of shareholder value, our customized fund allocates:
- 25% of assets to Attractive-or-better rated stocks (compared to 4% for DFCIX)
- 25% of assets to Unattractive-or-worse rated stocks (compared to 71% for DFCIX)
See a detailed view of the quality of stock allocations in our customized fund vs. DFCIX’s actual allocation here.
Active Management Strategy Fails to Find Value
In its prospectus, Delaware Smid Cap Growth Fund outlines the strategy for choosing investments for the fund:
- “The Fund invests primarily in growth-oriented companies that its Investment Manager believes have long-term capital appreciation potential”
- Uses “a top-down, thematic overlay combined with bottom-up fundamental research” that seeks to identify companies with:
- Competitive advantages
- Major demand trends
- High-quality earnings growth
Such a strategy sounds great – what investors wouldn’t want to own stocks with quality earnings and competitive advantages that position them to take advantage of market trends? The real issue is that we have no idea what “high quality” or “competitive advantage” means to the fund manager. Managers that tend to be less transparent in their language and methodology are usually less rigorous about how they pick stocks. After all, why wouldn’t managers want everyone to know how much work goes into building a portfolio?
Regardless of the level of transparency, without the use of reliable fundamental data and metrics that accurately reflect profitability and valuation (e.g. Core Earnings[3], ROIC, and price-to-economic book value (PEBV)) DFCIX routinely invests in stocks with low-quality earnings, negative cash flows, and expensive valuations.
Stock Selection Methodology Invests In Too Many Bad Stocks
Our research shows that DFCIX allocates to stocks with lower-quality earnings, lower ROICs, and higher valuations than the benchmark.
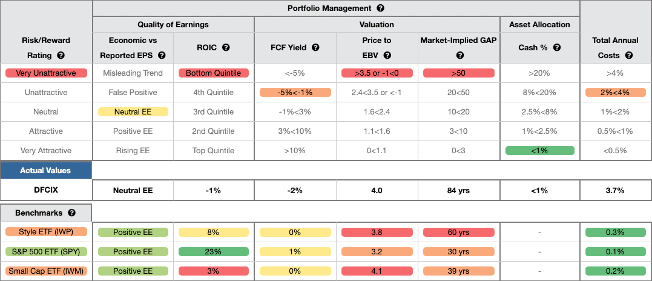
Figure 3 contains our detailed rating for DFCIX, which includes each of the criteria we use to rate all funds under coverage. These criteria are the same for our Stock Rating Methodology because the performance of a fund’s holdings equals the performance of a fund after fees.
Figure 3: Delaware Smid Cap Growth Fund Rating Breakdown
Sources: New Constructs, LLC and company, ETF and mutual fund filings
As Figure 3 shows, DFCIX’s holdings are inferior to its benchmark, IWP, and the S&P 500 (SPY). Specifically:
- DFCIX’s ROIC is -1% and below the 8% earned by IWP and 23% earned by SPY.
- DFCIX’s free cash flow yield of -2% is worse than the 0% of IWP and the 1% of SPY.
- The PEBV ratio for DFCIX is 4.0, which is greater than the 3.8 for IWP holdings and significantly greater than the 3.2 of SPY holdings.
- Our discounted cash flow analysis reveals an average market implied growth appreciation period (GAP) of 84 years for DFCIX’s holdings compared to 60 years for IWP and 30 years for SPY.
In other words, the stocks held by DFCIX generate inferior cash flows and have higher valuations compared to both IWP and SPY. The market expectations for stocks held by DFCIX imply profit growth (measured by PEBV ratio) that is well above the profit growth expectations embedded in IWP’s and SPY’s holdings.
Lower historical profits and higher expectations for future profits are a bad combination. Furthermore, in the current market, there is no reason to allocate to overvalued stocks when there are industry leading firms trading at discounted prices.
Portfolio Allocates to Some of the Most Dangerous Stocks
We have featured several of the highly overvalued stocks that DFCIX allocates to, such as Marvell Technology Group (MRVL), Planet Fitness (PLNT), Etsy (ETSY), and LYFT Inc. (LYFT). These companies have poor profitability and competitive disadvantages matched with valuations that imply they will significantly improve profitability and take market share.
Across its entire portfolio, 31 out of 40 holdings in our coverage universe (which equates to 77% of assets) have a market-implied GAP greater than 50 years. In other words, the stock prices of these companies imply they will earn an ROIC greater than weighted average cost of capital (WACC) on incremental investments for more than 50 years.
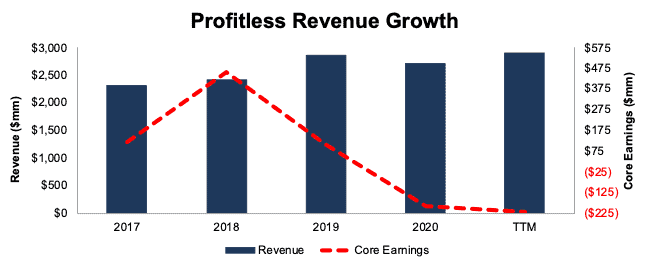
One of DFCIX’s largest holdings, Marvell Technology Group (MRVL: $52/share) poses particularly large risk for fiduciaries. Marvell has grown revenue from $2.3 billion in 2017 to $2.9 billion TTM, while Core Earnings have fallen from $119 million to -$217 million over the same time, per Figure 4.
Figure 4: Marvell’s Revenue & Core Earnings Since 2017
Sources: New Constructs, LLC and company filings
Economic earnings, which not only account for unusual items on the income statement but also changes to the balance sheet, look even worse. Economic earnings have declined from -$146 million in fiscal 2017 to -$782 million TTM. MRVL’s ROIC has also declined from 3% to -2% over the same time.
MRVL Is Priced to Take ~80% of Its TAM
Despite the deterioration in Marvell’s fundamentals, shares are up 98% over the past year (S&P +16%) and are significantly overvalued. We use our reverse discounted cash flow (DCF) model to quantify the growth in cash flows, and implied market share, Marvell must achieve to justify its valuation.
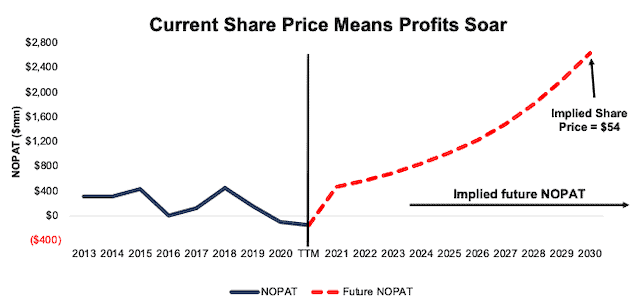
To justify its current price of $52/share, Marvell must immediately achieve a 15% NOPAT margin (above 10-year average of 10% and -5% TTM) and grow revenue by 21% compounded annually (compared to -0.4% CAGR since 2010 and consensus estimates of 13% compounded annually over the next four years) for the next 10 years. See the math behind this reverse DCF scenario.
Figure 5 compares the firm’s implied future NOPAT in this scenario to its historical NOPAT.
Figure 5: Current Valuation Implies Huge Growth in Profits
Sources: New Constructs, LLC and company filings.
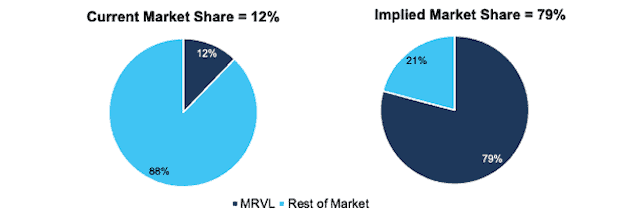
In this scenario, Marvell’s revenue would reach $18 billion, or 79% of its total addressable market (TAM), up from just 12% of its TAM based on fiscal 2020 revenue. See Figure 6.
Figure 6: Marvell’s Valuation Implies Huge Increase in Market Share
Sources: New Constructs, LLC and company filings.
Significant Downside Risk in Owning MRVL
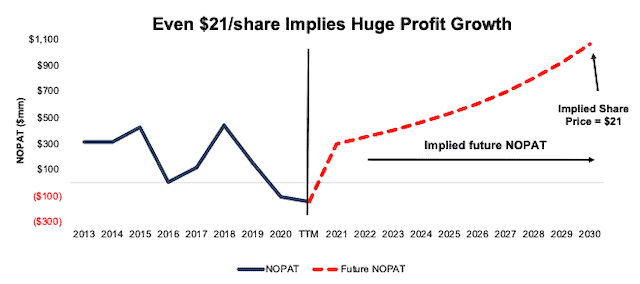
Even if Marvell grows at consensus estimates, the stock is severely overvalued. If we assume Marvell can achieve a 10% NOPAT margin (in-line with historical average) and grow revenue by 15% compounded annually (equal to consensus estimates from 2021-2023 and 15% each year thereafter, or a continuation of 2023 consensus estimates) for the next decade, the stock is worth only $21/share today – a 60% downside to the current stock price. See the math behind this reverse DCF scenario.
In this scenario, Marvell’s NOPAT grows from -$147 million TTM to $1.1 billion in 2030. For reference, the firm’s NOPAT fell from $411 million in 2010 to -$147 million TTM.
Figure 7 compares the firm’s implied future NOPAT in this scenario to its historical NOPAT.
Figure 7: MRVL Could Fall 60% Even if It Grows at Consensus Estimates
Sources: New Constructs, LLC and company filings.
Each of these scenarios also assumes Marvell is able to grow revenue, NOPAT, and FCF without increasing working capital or fixed assets. This assumption is unlikely but allows us to create best-case scenarios that demonstrate how high expectations embedded in the current valuation are.
Excessive Fees Make Outperformance Even More Difficult
At 3.68%, DFCIX’s total annual costs (TAC) are higher than 95% of the 363 Mid Cap Growth mutual funds under coverage. For comparison, the average TAC of all Mid Cap Growth mutual funds under coverage is 1.68%, the weighted average is 1.54%, and the benchmark ETF (IWP) has total annual costs of 0.26%.
Our TAC metric accounts for more than just expense ratios. We consider the impact of front-end loads, back-end loads, redemption fees, and transaction costs. For example, DFCIX’s front-end load adds 2.19% to its total annual costs and its annual turnover ratio of 113% adds 0.24% to its total annual costs – neither of which are captured by the expense ratio. Figure 8 shows our breakdown of DFCIX’s total annual costs, which is also available for all of the ~7,000 mutual funds under coverage.
Figure 8: Delaware Smid Cap Growth Fund Total Annual Costs Breakdown

Sources: New Constructs, LLC and company, ETF and mutual fund filings
To justify its higher fees, each class of the fund must outperform its benchmark by the following amounts over three years:
- DFDIX must outperform by an average of 1.2% annually.
- DFZRX must outperform by an average of 1.1% annually.
- DFRIX must outperform by an average of 1.7% annually.
- DEEVX must outperform by an average of 2.3% annually.
- DFCIX must outperform by an average of 3.4% annually.
An in-depth analysis of DFCIX and its TAC is available in our standard mutual fund report.
DFCIX’s Past Performance Is No Guarantee of Success Going Forward
Although DFCIX has outperformed its benchmark over the past 10 years, past performance is no guarantee of future results, and based on the quality of their current holdings, we expect DFCIX to underperform going forward.
Given that 71% of assets are allocated to stocks with Unattractive-or-worse ratings, DFCIX looks likely to underperform moving forward.
The Importance of Holdings-Based Fund Analysis
Smart fund (or ETF) investing means analyzing the holdings of each mutual fund. Failure to do so is a failure to perform proper due diligence. Simply buying a mutual fund or ETF based on past performance does not necessarily lead to outperformance. Similarly, blindly diversifying through index funds is no substitute for diligence. Only through holdings-based analysis can one determine if a fund’s methodology leads managers to pick high-quality or low-quality stocks.
However, most investors don’t realize they can access sophisticated fundamental research[4] using data that corrects market inefficiencies and generates alpha. Our Robo-Analyst technology analyzes the holdings of all 375 ETFs and mutual funds in the mid cap growth and ~7,600 ETFs and mutual funds under coverage to avoid “the danger within.” This diligence allows us to cut through the noise and identify potentially dangerous funds that traditional, backward-looking fund research may overlook, such as DFCIX.
Our clients can directly leverage holdings-based analysis and create their own mid cap fund while avoiding the management fees that DFCIX and other mutual funds charge.
Better-Rated Mid-Cap Growth Funds
The following are two Mid Cap Growth mutual funds that earn an Attractive rating, have more than $100 million in assets under management, and have below average TAC.
- Touchstone Mid Cap Fund (TMPIX) – 1.03% TAC
- Congress Mid Cap Growth Fund (IMIDX) – 0.98% TAC
This article originally published on February 1, 2021.
Disclosure: David Trainer, Kyle Guske II, Alex Sword and Matt Shuler receive no compensation to write about any specific stock, sector, style, or theme.
Follow us on Twitter, Facebook, LinkedIn, and StockTwits for real-time alerts on all our research.
[1] Three independent studies from respected institutions prove the superiority of our data, models, and ratings. Learn more here.
[2] We cover 9 of DFCIX’s top 10 holdings.
[3] Core Earnings are a superior measure of profits, as demonstrated in Core Earnings: New Data & Evidence, a paper by professors at Harvard Business School (HBS) & MIT Sloan. Recently accepted by the Journal of Financial Economics, the paper proves that our data is superior to all the metrics offered elsewhere.
[4] Compare our analytics on a mega cap company to Bloomberg and Capital IQ’s (SPGI) analytics in the detailed appendix of this paper.