
Five new stocks make January’s Exec Comp Aligned with ROIC Model Portfolio, available to members as of January 13, 2022.
Recap From December’s Picks
Our Exec Comp Aligned with ROIC Model Portfolio (+0.4%) outperformed the S&P 500 (0.1%) from December 15, 2021, through January 11, 2022. The best performing stock in the portfolio was up 8%. Overall, seven out of the 15 Exec Comp Aligned with ROIC Stocks outperformed the S&P 500 from December 15, 2021, through January 11, 2022.
More reliable & proprietary fundamental data, proven in The Journal of Financial Economics, drives our research and provides investors with a new source of alpha. Our proprietary Robo-Analyst technology[1] scales our forensic accounting expertise (featured in Barron’s) across thousands of stocks[2] to produce an unrivaled database of fundamental data.
This Model Portfolio only includes stocks that earn an Attractive or Very Attractive rating and align executive compensation with improving ROIC. We think this combination provides a uniquely well-screened list of long ideas because return on invested capital (ROIC) is the primary driver of shareholder value creation.
New Stock Feature for January: Williams-Sonoma Inc. (WSM: $142/share)
Williams-Sonoma Inc. (WSM) is the featured stock in January’s Exec Comp Aligned with ROIC Model Portfolio. We first made Williams-Sonoma a Long Idea in September 2016. Since then, the stock is up 195% vs. a 113% gain for the S&P 500. See our latest report on William-Sonoma here.
Williams-Sonoma has grown revenue and net operating profit after tax (NOPAT) by 7% and 12% compounded annually, respectively over the past decade, per Figure 1. The company’s NOPAT margin grew from 7% in fiscal 2011 to 13% over the trailing twelve-month (TTM) period, while invested capital turns improved from 1.5 to 2.7 over the same time. Rising NOPAT margins and invested capital turns drive the company’s ROIC from 10% in fiscal 2011 to 36% TTM.
Figure 1: Williams-Sonoma’s NOPAT & Revenue Growth: Fiscal 2011 – TTM
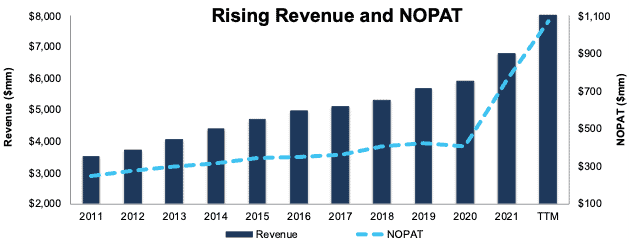
Sources: New Constructs, LLC and company filings
COVID-driven acceleration of ecommerce and the work-from-home trend boosts Williams-Sonoma’s TTM NOPAT as it did many firms. As detailed in our last report, we believe Williams-Sonoma’s strong omni-channel operation positions it to continue to take share and outperform even after the COVID boost to its business fades.
ROIC-Based Pay Properly Incentivizes Executives
Williams-Sonoma’s executive compensation plan aligns executives’ interests with shareholders’ interests by tying the payout of performance stock units to the achievement of a three-year target ROIC.
Williams-Sonoma’s inclusion of ROIC as an executive compensation performance goal has helped drive shareholder value creation through rising ROIC and economic earnings. Over the trailing twelve months, William-Sonoma’s ROIC is 36% and its economic earnings are $893 million. As mentioned above, post-pandemic these numbers will likely come down as consumer demand normalizes. However, for reasons discussed in our original report, we believe the company is well-positioned for post-pandemic ROIC to trend higher from its pre-pandemic level. Williams-Sonoma’s ROIC improved from 4% in fiscal 2009 to 13% in fiscal 2020 and the company’s economic earnings grew from -$18 million to $541 million over the same period.
Figure 2: Williams-Sonoma’s ROIC: Fiscal 2009 – TTM
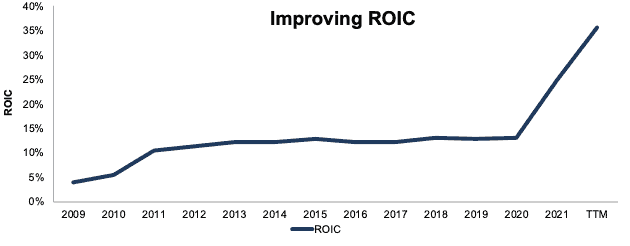
Sources: New Constructs, LLC and company filings
Williams-Sonoma Is Undervalued
At its current price of $143/share, WSM has a price-to-economic book value (PEBV) ratio of 0.6. This ratio means the market expects Williams-Sonoma’s NOPAT to permanently decline by 40%. This expectation seems overly pessimistic for a company that has grown NOPAT by 14% compounded annually over the past two decades.
If Williams-Sonoma’s NOPAT margin falls to 10% (vs. 13% TTM) NOPAT and the company grows NOPAT by 4% compounded annually over the next 10 years, the stock is worth $202/share today – a 41% upside. See the math behind this reverse DCF scenario. Should the company grow NOPAT more in line with historical growth rates, the stock has even more upside.
Critical Details Found in Financial Filings by Our Robo-Analyst Technology
Below are specifics on the adjustments we make based on Robo-Analyst findings in Williams-Sonoma’s 10-K and 10-Qs:
Income Statement: we made $125 million in adjustments, with a net effect of removing $79 million in non-operating expenses (1% of revenue). You can see all the adjustments made to Williams-Sonoma’ income statement here.
Balance Sheet: we made $1.6 billion in adjustments to calculate invested capital with a net decrease of $342 million. One of the largest adjustments was $132 million (5% of reported net assets) in asset write-downs. You can see all the adjustments made to Williams-Sonoma’ balance sheet here.
Valuation: we made $1.8 billion in adjustments with a net effect of decreasing shareholder value by $1.3 billion. Apart from total debt, the most notable adjustment to shareholder value was $255 million in excess cash. This adjustment represents 2% of Williams-Sonoma’s market cap. See all adjustments to Williams-Sonoma’ valuation here.
This article originally published on January 24, 2022.
Disclosure: David Trainer, Kyle Guske II, and Matt Shuler receive no compensation to write about any specific stock, style, or theme.
Follow us on Twitter, Facebook, LinkedIn, and StockTwits for real-time alerts on all our research.
[1] Harvard Business School features our research automation technology in the case Disrupting Fundamental Analysis with Robo-Analysts.
[2] See how our models overcome flaws in Bloomberg and Capital IQ’s (SPGI) analytics in the detailed appendix of this paper.