
13 new stocks make our Safest Dividend Yields Model Portfolio this month, which was made available to members on March 19, 2021.
Recap from February’s Picks
On a price return basis, our Safest Dividend Yields Model Portfolio (+8.5%) outperformed the S&P 500 (+1.7%) by 6.8% from February 18, 2021 through March 17, 2021. On a total return basis, the Model Portfolio (+8.9%) outperformed the S&P 500 (+1.7%) by 7.2% over the same time. The best performing large cap stock was up 20% and the best performing small cap stock was up 23%. Overall, 16 out of the 18 Safest Dividend Yield stocks outperformed their respective benchmarks (S&P 500 and Russell 2000) from February 18, 2021 through March 17, 2021.
More reliable & proprietary fundamental data, proven in The Journal of Financial Economics, drives our research. Our proprietary Robo-Analyst technology[1] scales our forensic accounting expertise (featured in Barron’s) across thousands of stocks[2] to produce an unrivaled database of fundamental data.
This Model Portfolio only includes stocks that earn an Attractive or Very Attractive rating, have positive free cash flow and economic earnings, and offer a dividend yield greater than 3%. Companies with strong free cash flow provide higher quality and safer dividend yields because we know they have the cash to support the dividend. We think this portfolio provides a uniquely well-screened group of stocks that can help clients outperform.
Featured Stock for March: Verizon Communications Inc. (VZ: $56/share)
Verizon Communications Inc. (VZ) is the featured stock in March’s Safest Dividend Yields Model Portfolio.
We most recently made Verizon a Long Idea in October 2020, which reiterated our September 2019 report. While the stock has underperformed as a Long Idea since both reports were published, VZ remains attractive.
Verizon has grown revenue by 4% compounded annually and net operating profit after tax (NOPAT) by 5% compounded annually over the past two decades. Verizon’s NOPAT margin increased from 15% in 2016 to 20% in 2020 while its return on invested capital (ROIC) improved from 6% to 8% over the past decade.
The firm’s economic earnings, or the true cash flows of the business, rose from $10 billion in 2016 to nearly $17 billion in 2020.
Figure 1: Verizon’s Revenue & NOPAT Since 2016
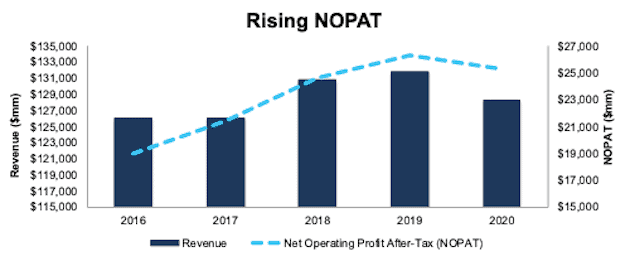
Sources: New Constructs, LLC and company filings
Cash Flow Supports Dividend Payments
Verizon has increased its dividend for 14 consecutive years. More recently, the firm increased its dividend payments from $2.29/share in 2016 to $2.49/share in 2020, or 2% compounded annually. The current quarterly dividend, when annualized provides a 4.5% dividend yield.
Since 2015, Verizon’s cumulative FCF easily covers it annual dividend payments even after the $3.4 billion spent to acquire Fleetmatics and Telogis in 2016 as well as the $6.4 billion spent to acquire Yahoo, XO Communications’ fiber business, and fiber optic network assets from WideOpenWest in 2017. Over the past five years, Verizon generated $63.2 billion (27% of current market cap) in FCF while paying $48.8 billion in dividends, per Figure 2.
Figure 2: Verizon’s FCF vs. Dividends Since 2015
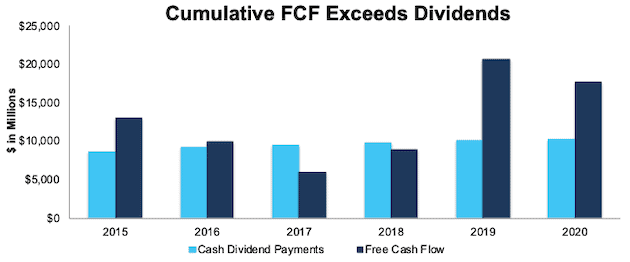
Sources: New Constructs, LLC and company filings
Companies with strong FCF provide higher quality dividend yields because we know the firm has the cash to support its dividend. On the other hand, dividends from companies with low or negative FCF cannot be trusted as much because the company may not be able to sustain paying dividends.
VZ Is Undervalued
At its current price of $56/share, VZ has a price-to-economic book value (PEBV) ratio of 0.3. This ratio means the market expects Verizon’s NOPAT to permanently decline by 70%. This expectation seems overly pessimistic given that Verizon has grown NOPAT by 4% compounded annually over the past five years and 5% compounded annually over the past two decades.
Even if Verizon’s NOPAT margin falls to 10% (twenty-year low, vs. 20% in 2020) and the firm grows revenue by just 1% compounded annually over the next decade, the stock is worth $82/share today – a 46% upside. In this scenario, Verizon’s NOPAT falls by 6% compounded annually over the next ten years. See the math behind this reverse DCF scenario.
Critical Details Found in Financial Filings by Our Robo-Analyst Technology
Fact: we provide superior fundamental data and earnings models – unrivaled in the world.
Proof: Core Earnings: New Data & Evidence, forthcoming in The Journal of Financial Economics.
Below are specifics on the adjustments we make based on Robo-Analyst findings in Verizon’s 10-K:
Income Statement: we made $8.9 billion of adjustments with a net effect of removing $7.5 billion in non-operating expenses (6% of revenue). See all adjustments made to Verizon’s income statement here.
Balance Sheet: we made $168 billion of adjustments to calculate invested capital with a net increase of $49 billion. The most notable adjustment was $71 billion (26% of reported net assets) in deferred tax assets. See all adjustments to Verizon’s balance sheet here.
Valuation: we made $254 billion of adjustments with a net effect of decreasing shareholder value by $215 billion. Apart from total debt, one of the most notable adjustments to shareholder value was $20 billion in excess cash. This adjustment represents 9% of Verizon’s market value. See all adjustments to Verizon’s valuation here.
This article originally published on March 24, 2021.
Disclosure: David Trainer, Kyle Guske II, Alex Sword and Matt Shuler receive no compensation to write about any specific stock, style, or theme.
Follow us on Twitter, Facebook, LinkedIn, and StockTwits for real-time alerts on all our research.
[1] Harvard Business School features our research automation technology in the case Disrupting Fundamental Analysis with Robo-Analysts.
[2] See how our models overcome flaws in Bloomberg and Capital IQ’s (SPGI) analytics in the detailed appendix of this paper.