We published an update on this Long Idea on July 28, 2021. A copy of the associated Earnings Update report is here.
This best-in-class operator with 14 consecutive years of dividend increases and strong free cash flow generation can bring some certainty to your portfolio. Regardless of 2020’s election results, this firm’s prospects for continued long-term profit growth are much brighter than the stock’s valuation implies. We see 5G as a catalyst for this firm to demonstrate that its superior network and customer loyalty position it to grow market share and profits. Given that the current stock price implies profits will permanently decline by more than 40%, we think this firm offers excellent risk/reward. Verizon Communications (VZ: $57/share) is this week’s Long Idea[1].
There is lots of upside in owning this stock based on Verizon’s:
- Superior network
- Lowest customer churn
- Long-term demand growth for mobile data
- Superior profitability to peers
Verizon Is Widely Recognized as the Best-in-Class Provider
Verizon provides the best network experience for users. Several third-party resources affirm the reliability and speed of the firm’s network. The following is a list of third-party reviews of Verizon’s network:
- J.D. Power named Verizon the Most Awarded Wireless Company for Network Quality 25 consecutive times over the past 12 years.
- American Customer Satisfaction Index reports Verizon leads the competition based on customer evaluations of call quality, call reliability, network coverage, and data speed.
- PC Mag named Verizon the fastest mobile network for 2020. Even with only 4% of its 5G network available (vs. 38% for AT&T and 54% for T-Mobile), Verizon’s mainly 4G LTE network still outperformed the competition.
- RootMetrics reports that Verizon outperforms the competition in reliability, accessibility, speed, data performance, voice performance, and calling.
- Tom’s Guide found that Verizon’s average LTE download speeds were much faster than AT&T and T-Mobile.
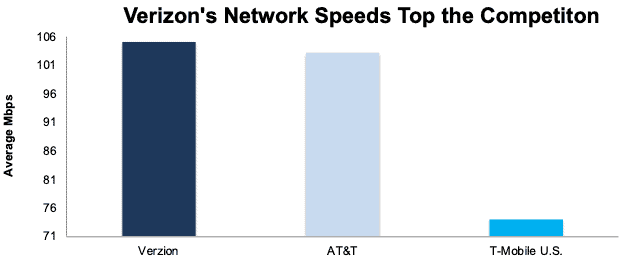
PC Mag recently tested Verizon, AT&T, and T-Mobile’s networks and found Verizon had the fastest download speeds. Figure 1 shows that Verizon’s network averaged download speeds of 105.1 megabits per second (Mbps), AT&T averaged 103.1 Mbps, and T-Mobile averaged a much lower 74 Mbps.
Figure 1: Average Download Speeds Across Verizon, AT&T & T-Mobile Networks
Sources: pcmag.com
Verizon not only has the fastest network, but it also has the most 4G coverage. Verizon covers 70% of the United States with 4G. For comparison, AT&T covers 68% and T-Mobile covers 62% of the U.S. Verizon’s superior 4G network will continue to remain an integral part of its business for many more years.
While 5G is the future of the industry, adoption of the new technology is taking a lot of time. Statista expects that only 14% of mobile connections in North America will be on 5G networks in 2021, a level that will grow to just 46% by 2025.
Verizon’s 4G Is Still Better Than AT&T’s 5G
T-Mobile and AT&T have rushed to announce nationwide 5G service, which may lead many to believe that 5G has arrived. However, not all 5G is the same. Some 5G networks are faster than others.
Depending on which frequency a carrier uses, speeds will vary dramatically. T-Mobile and AT&T’s nationwide 5G primarily use the low-band frequency which allows for maximum coverage but not much, if any, speed improvement. While marketing large 5G coverage maps, the actual results leave a lot to be desired, and has resulted in the term “faux-G” being used to describe these networks. For example, in PCMag’s annual mobile network testing, AT&T’s 5G service was actually slower than its own 4G service in 21 of 22 cities tested.
Meanwhile, Verizon’s superior 4G network enables it to leverage new Dynamic Spectrum Sharing (DSS) technology to match the speed of AT&T’s 5G despite a smaller 5G footprint in the near term. Case in point, OpenSignal found in its 5G User Experience Report that overall 5G network speeds at Verizon and AT&T were statistically tied, despite AT&T deploying its nationwide 5G network in a much larger scale.
Building Best-In-Class 5G to Widen Its Moat
Having a superior network affords Verizon the time to build out a much better 5G network that will drive superior profit growth long term.
Verizon is developing a more transformational 5G Ultra Wideband network based on higher frequencies that allow average download speeds of 793 Mbps, or more than 10x competitors’ download speeds, albeit at the expense of coverage range in the near term.
5G Ultra Wideband is available in 55 cities and is on schedule to reach its goal of 60 cities (nearly double the 31 cities covered in 2019) by the end of the year. For comparison, AT&T has launched its high-frequency 5G in only 35 cities so far.
While 5G Ultra Wideband’s availability is increased, Verizon is not conceding the PR battle to T-Mobile and AT&T without a fight. The firm recently rolled out its own nationwide 5G, which is now available to more than 200 million people in 1,800 cities. For comparison, AT&T’s nationwide 5G covers 205 million people and T-Mobile’s nationwide 5G covers 225 million people.
Superior Network Drives Superior Customer Loyalty
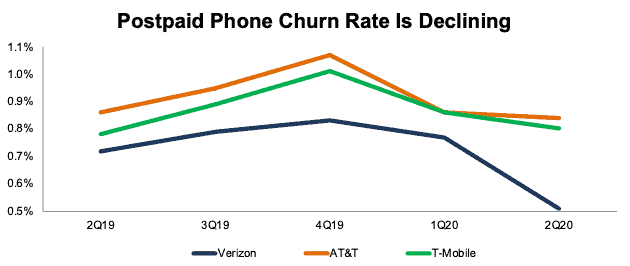
Verizon’s superior network quality (measured by speed and coverage) is a key competitive advantage that allows the firm to have the lowest postpaid phone churn rate in the industry. Verizon is driving churn rate even lower, too. Over the past the past four quarters, the firm has improved its industry-leading churn rate from 0.72% in 2Q19 to just 0.51% in 2Q20. For comparison, AT&T’s postpaid phone-only churn rate was 0.95% in 2019 and T Mobile’s branded postpaid phone churn in 1Q20 was 0.86%.
Figure 2: Verizon, AT&T & T- Mobile’s Postpaid Phone Churn Rates Since 2Q19
Sources: New Constructs, LLC and company filings.
Secular Growth in Mobile Data Consumption Supports Long-Term Revenue Growth
Rising cellphone usage leads to more data consumption, which drives revenue growth for Verizon.
Cell phone access of the internet is rising strongly. In 2013, 19% of all U.S. adults accessed the internet through a cellphone. By 2019, that number rose to 37%. Additionally, the average time spent on mobile devices per day for Americans has risen from two hours and thirty-two minutes in 2014 to four hours and thirty-three minutes before the COVID-19 pandemic. Time on mobile devices is now up to five hours and two minutes during the pandemic.
ReportLinker forecasts global mobile data traffic will grow 27% compounded annually through 2027.
We think the many benefits of increased speed from 5G only accentuate cell phone usage and mobile data consumption.
Further, we think having a superior network will give Verizon more pricing power than its competition. With just over 50% of its customers on unlimited plans, Verizon can move more of its customer based into these higher-priced plans as well as raise the price of those plans.
Verizon’s Profitability Is Superior to Peers
Verizon not only has a best-in-class network that can stand toe-to-toe with competitors’ next generation offerings, but it also earns best-in-class margins returns on invested capital (ROIC). Verizon’s net operating profit after-tax (NOPAT) margin of 18% is superior to T-Mobile and AT&T. The firm’s invested capital turns of 0.4 are below T-Mobile and above AT&T.
Figure 3: Verizon’s NOPAT Margin, Invested Capital Turns & ROIC vs. Peers

Sources: New Constructs, LLC and company filings.
Per Figure 4, the gap between Verizon’s ROIC and its peers’ average has widened from 2.4% in 2017 to 3.2% TTM. Verizon’s improving ROIC indicates that Verizon’s CEO, who started in 2018, has the firm moving in the right direction.
Figure 4: Verizon’s ROIC is Increasing Faster than Peers’

Sources: New Constructs, LLC and company filings.
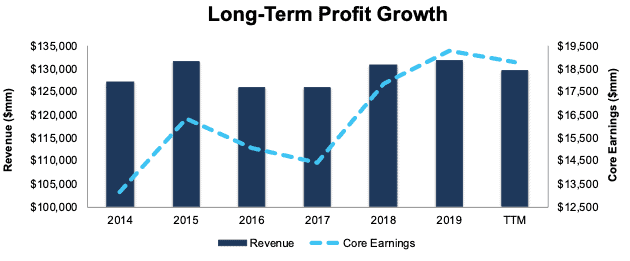
Over the past decade, Verizon grew revenue by 2% compounded annually and core earnings[2] by 11% compounded annually. The firm increased its core earnings margin from 6% in 2019 to 14% over the TTM. More recently, Verizon grew core earnings by 8% compounded annually over the past five years per Figure 5.
Figure 5: Core Earnings & Revenue Growth Since 2014
Sources: New Constructs, LLC and company filings.
Strong Cash Flows Make Dividend Yield Safer in Uncertain Times
For investors searching for yield, Verizon (VZ) stands out as a firm with a high dividend yield and the cash flows to support it. Firms with cash flows greater than dividend payments have a higher likelihood to maintain and grow dividends over the long term.
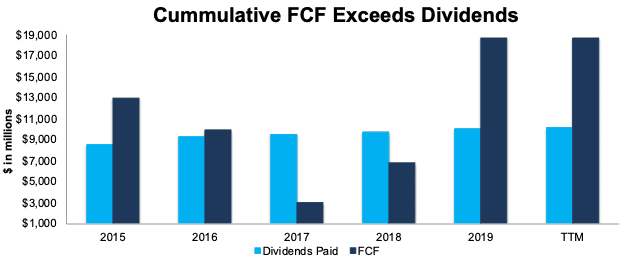
Verizon has increased its dividend in each of the past 14 years. Over the past five years, the firm generated more in in FCF ($51.5 billion) than it paid out in dividends ($47.1 billion), or an average $890 million surplus each year. Over the TTM, the firm generated $18.7 billion in FCF while paying out $10.1 billion in dividends. Its last quarterly dividend, when annualized, equals $2.46/share and provides a 4.4% yield.
Figure 6: Dividends Paid & FCF Since 2015
Sources: New Constructs, LLC and company filings.
In addition to dividends, the firm authorized the repurchase of up to 100 million (2.4% of total shares outstanding) shares, though it has not repurchased shares since 2015. If Verizon decides to utilize its authorization and repurchase shares once again, investors would get an even greater yield.
Despite Consistently High Profitability, VZ Is Undervalued
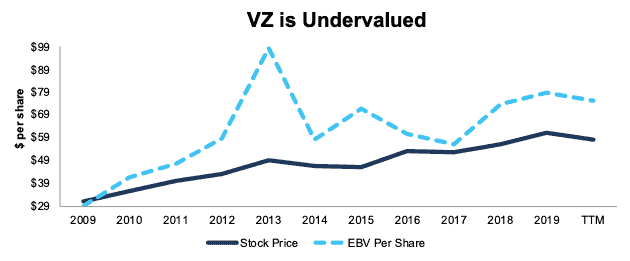
Despite building out the most reliable wireless network and consistent free cash flow generation, VZ trades well below its economic book value[3] (EBV), or no-growth value. Its current price-to-economic book value (PEBV) ratio of 0.6 is the cheapest since 2013. This ratio means the market expects Verizon’s NOPAT to permanently decline by 40%. This expectation seems overly pessimistic over the long term. For reference, Verizon has grown NOPAT by 4% compounded annually over the past five years.
Verizon’s current economic book value (calculated using a five-year average WACC) is $75/share – a 32% upside to the current stock price.
Figure 7: Stock Price vs. Economic Book Value (EBV) per Share With 5-Year Average WACC
Sources: New Constructs, LLC and company filings.
VZ’s Current Price Implies 40% NOPAT Decline
Below, we use our reverse DCF model to quantify the cash flow expectations baked into Verizon’s current stock price. Then, we analyze the implied value of the stock based on different assumptions about Verizon’s future growth in cash flows.
Scenario 1: We can model the worst-case scenario already implied by Verizon’s current stock price. In this scenario, we assume:
- NOPAT margins fall to 17% (10-year average compared to 18% TTM)
- Revenue falls 1% compounded annually for eight years (compared to +1% compounded annual consensus estimated revenue growth from 2020 to 2023)
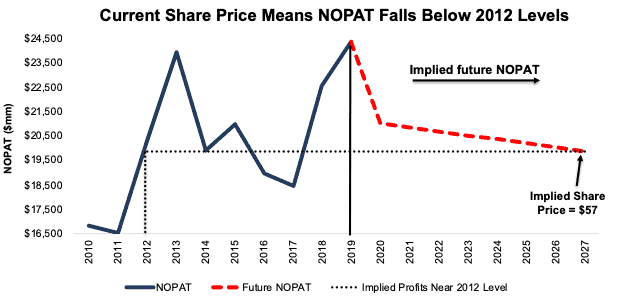
In this scenario, where Verizon’s NOPAT declines 2% compounded annually over the next eight years, the stock is worth $57/share today – equal to the current stock price. See the math behind this reverse DCF scenario.
Figure 8 compares the firm’s implied future NOPAT in this scenario to its historical NOPAT. This worst-case scenario implies Verizon’s NOPAT eight years from now will be 18% below its 2019 NOPAT. In other words, this scenario implies that eight years from now, Verizon’s NOPAT will still be below 2012 levels. In any scenario better than this one, VZ holds significant upside potential, as we’ll show below.
Figure 8: Current Valuation Implies Severe, Long-Term Decline in Profits: Scenario 1
Sources: New Constructs, LLC and company filings.
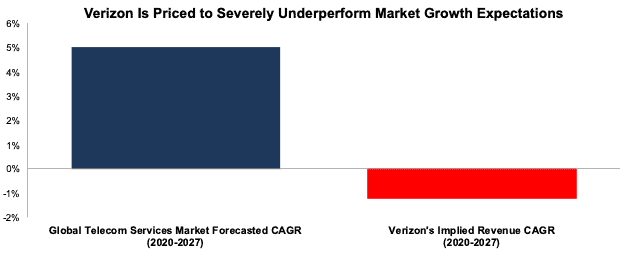
Figure 9 compares the expected growth of the Global Telecom Services Market at 5% compounded annually from 2020 to 2027 to the decline in revenue (-1% CAGR over the same time) implied by Verizon’s stock price.
Figure 9: Current Valuation Implies Negative Revenue Growth While Industry Grows at 5%
Sources: New Constructs, LLC and company filings and Grand View Research.
Scenario 2: Conservative Growth Assumptions Highlight VZ Upside Potential
If we conservatively assume Verizon moderately grows revenue, the stock is significantly undervalued.
In this scenario, we assume:
- NOPAT margins fall to 17% (10-year average compared to 18% TTM)
- Revenue grows 1% compounded annually (equal to compounded annual consensus estimated revenue growth from 2020 to 2023) over the next eight years
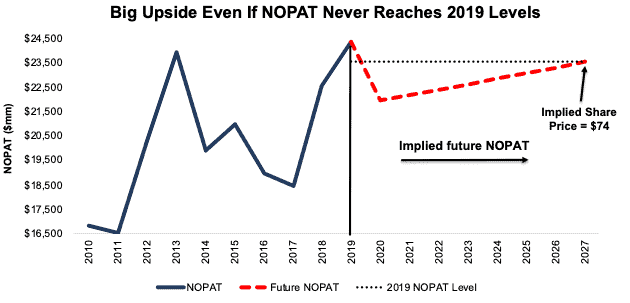
In this scenario, Verizon’s NOPAT falls by less than 1% compounded annually over the next decade (including a 10% drop in 2020) and the stock is worth $74/share today – a 30% upside to the current price. See the math behind this reverse DCF scenario.
For comparison, Verizon has grown NOPAT by 4% compounded annually over the past decade. It’s not often investors get the opportunity to buy an industry-leading company at such a discounted price.
Figure 10 compares the firm’s implied future NOPAT in scenario 2 to its historical NOPAT. This scenario implies that a decade from now, Verizon’s NOPAT will be 3% below 2019 levels. If profits grow faster, VZ has even more upside potential.
For reference, Verizon grew NOPAT by 11% compounded annually in the eight years after launching its 3G network in 2002 and by 4% compounded annually in the eight years following its 4G launch in December 2010.
Figure 10: Plenty of Upside in Verizon
Sources: New Constructs, LLC and company filings.
Sustainable Competitive Advantages Will Drive Shareholder Value Creation
Here’s a summary of why we think the moat around Verizon’s business will enable it to continue to generate higher NOPAT than the current market valuation implies. The following competitive advantages help Verizon survive the downturn and return to growth as the economy rebounds:
- Developing fastest 5G network that leverages existing network to remain fastest
- Lowest customer churn
- Large barriers to entry
What Noise Traders Miss with Verizon
These days, fewer investors focus on finding quality capital allocators with shareholder friendly corporate governance. Instead, due to the proliferation of noise traders, the focus is on short-term technical trading trends while high-quality fundamental research is overlooked. Here’s a quick summary of what noise traders are missing:
- Wide moat around its superior network
- Long-term growth in wireless data consumption
- Valuation implies permanent profit decline
Catalysts: A Consensus Beat & 5G Rollout
According to Zacks, consensus estimates at the end of January pegged Verizon’s 2020 EPS at $4.95/share. Jump forward to October 19 and consensus estimates for Verizon’s 2020 EPS have fallen slightly to $4.77/share. 2021 estimates follow a similar trend. At the end of January, 2021 EPS consensus was $5.14/share and has since fallen to $4.94/share.
Lowered expectations for future earnings provide a great opportunity for a strong company, such as Verizon, to beat consensus. Our current Earnings Distortion Score, which is a short-term indicator of the likelihood to beat or miss expectations, for Verizon is “In-Line.” However, extremely low (permanent 40% decline in profits) expectations in the stock price provide a large margin of safety for VZ and mean the stock could move higher for simply meeting expectations.
The firm beat EPS estimates in nine of the past 10 quarters and doing so again could send shares higher.
Should the firm’s FCF continue to trend higher, Verizon might also consider a larger than normal dividend increase or resume share buybacks, which could drive more investors to the stock.
Over the long term, we see 5G as a catalyst for Verizon to demonstrate that its superior network and customer loyalty position it to grow market share and profits, which would enable Verizon to beat on the top and bottom lines.
Executive Compensation Could Be Improved but Raises No Red Flags
No matter the macro environment, investors should look for companies with executive compensation plans that directly align executives’ interests with shareholders’ interests. Quality corporate governance holds executives accountable to shareholders by incentivizing them to allocate capital prudently.
Verizon’s executive compensation plan pays annual cash bonuses, quarterly cash bonuses, restricted stock units (RSUs), and performance stock units (PSUs).
Annual cash bonuses are tied to adjusted EPS, free cash flow, total revenue, and diversity and sustainability. PSUs are tied to total shareholder return and cumulative free cash flow.
We would prefer the firm use ROIC improvement when determining executive compensation, as there is a strong correlation between improving ROIC and increasing shareholder value. Having accurate values for NOPAT and invested capital ensures investors have an apples-to-apples metric for measuring corporate performance and holds management accountable for every dollar invested into the company.
Despite not using ROIC when measuring performance, Verizon’s compensation plan has not compensated executives while destroying shareholder value. Verizon has grown economic earnings from $5.1 billion in 2017 to $10.1 billion TTM.
Insider Trading and Short Interest Trends
Over the past twelve months, insiders have bought a total of 19 thousand shares and sold 302 thousand shares for a net effect of 283 thousand shares sold. These sales represent less than 1% of shares outstanding.
There are currently 27 million shares sold short, which equates to 1% of shares outstanding and two days to cover. Short interest is down 10% from the prior month. The low short interest indicates not many investors are willing to bet against this firm.
Critical Details Found in Financial Filings by Our Robo-Analyst Technology
As investors focus more on fundamental research, research automation technology is needed to analyze all the critical financial details in financial filings as shown in the Harvard Business School and MIT Sloan paper, "Core Earnings: New Data and Evidence”.
Below are specifics on the adjustments we make based on Robo-Analyst findings in Verizon’s 2019 10-K:
Income Statement: we made $14.3 billion of adjustments, with a net effect of removing $5.1 billion in non-operating expenses (4% of revenue). You can see all the adjustments made to Verizon’s income statement here.
Balance Sheet: we made $152.4 billion of adjustments to calculate invested capital with a net increase of $72.3 billion. One of the largest adjustments was $69.3 billion in deferred tax assets. This adjustment represented 28% of reported net assets. You can see all the adjustments made to Verizon’s balance sheet here.
Valuation: we made $211.1 billion of adjustments with a net effect of decreasing shareholder value by $200.5 billion. Apart from total debt, one of the most notable adjustments to shareholder value was $16.7 billion in underfunded pensions. This adjustment represents 7% of Verizon’s market cap. See all adjustments to Verizon’s valuation here.
Attractive Funds That Hold VZ
The following funds receive our Attractive-or-better rating and allocate significantly to VZ:
- iShares US Telecommunications ETF (IYZ) – 22.9% allocation and Very Attractive rating
- Deutsche DWS Communications Fund (FTICX) – 6.9% allocation and Attractive rating
- iShares Core High Dividend ETF (HDV) – 6.5% allocation and Attractive rating
- Vanguard Communication Services Index Fund (VTCAX) – 5.5% allocation and Attractive rating
- Integrity Dividend Harvest Fund (IDHIX) – 5.5% allocation and Attractive rating
- Fidelity MSCI Communication Services Index ETF (FCOM) – 5.5% allocation and Attractive rating
- Invesco Dow Jones Industrial Average Div ETF (DJD) – 5.5% allocation and Very Attractive rating
- WisdomTree US Quality Dividend Growth Fund (DGRW) – 5.3% allocation and Very Attractive rating
- Stock Dividend Fund, Inc (SDIVX) – 5.3% allocation and Very Attractive rating
- Brown Advisory - Beutel Goodman Large Cap Value Fund (BVALX) – 5.0% allocation and Very Attractive rating
This article originally published on October 21, 2020.
Disclosure: David Trainer, Kyle Guske II, and Matt Shuler receive no compensation to write about any specific stock, style, or theme.
Follow us on Twitter, Facebook, LinkedIn, and StockTwits for real-time alerts on all our research.
[1] Since we first made Verizon a Long Idea in September 2019, the stock has earned a 4% total return. Based on price, VZ is down 2% versus +17% for the S&P 500.
[2] Our core earnings are a superior measure of profits, as demonstrated in Core Earnings: New Data & Evidence a paper by professors at Harvard Business School (HBS) & MIT Sloan. The paper empirically shows that our data is superior to “Operating Income After Depreciation” and “Income Before Special Items” from Compustat, owned by S&P Global (SPGI).
[3]We utilized the override capability in our Company Valuation Model to calculate VZ’s TTM EBV using the firm’s five-year average weighted average cost of capital (WACC) to derive an EBV that is less sensitive to any changes in WACC. This approach is especially useful in the current low interest rate environment. While we do not know where interest rates will go in the future, calculating EBV with longer-term average WACC gives a more conservative EBV in the event interest rates increase in the future.
