10 new stocks make our Most Attractive list this month, and six new stocks fall onto the Most Dangerous list this month. July’s Most Attractive and Most Dangerous stocks were made available to members on July 2, 2019.
The successes of these model portfolios highlight the value of our machine learning and AI Robo-Analyst technology[1], which helps clients fulfill the fiduciary duty of care and make smarter investments[2].
Our Most Attractive stocks have high and rising returns on invested capital (ROIC) and low price to economic book value ratios. Most Dangerous stocks have misleading earnings and long growth appreciation periods implied by their market valuations.
Most Attractive Stocks Feature for July: Discover Financial Services (DFS: $80/share)
Discover Financial Services (DFS) is the featured stock from July’s Most Attractive Stocks Model Portfolio.
Since 2012, DFS’ revenue has grown 6% compounded annually while after-tax profit (NOPAT) has grown 7% compounded annually. DFS’ trailing twelve month (TTM) NOPAT is also up 7% over the prior TTM period. NOPAT margin has improved from 22% in 2012 to 23% TTM while its return on invested capital (ROIC) improved from 19% to 21%.
Figure 1: DFS’ Revenue & NOPAT Since 2012
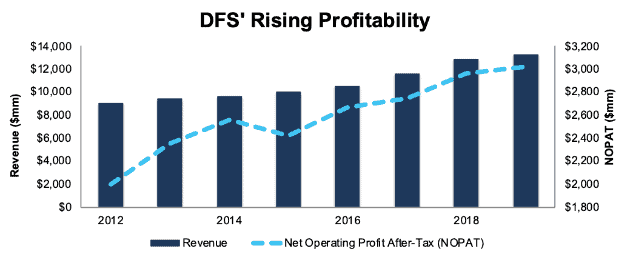
Sources: New Constructs, LLC and company filings
DFS Valuation Provides Significant Upside Potential
At its current price of $80/share, DFS has a price-to-economic book value (PEBV) ratio of 0.7. This ratio means the market expects DFS’ NOPAT to permanently decline by 30%. This expectation seems overly pessimistic for a firm that has grown NOPAT by 7% compounded annually since 2012.
If DFS can maintain TTM NOPAT margins (23%) and grow NOPAT by just 3% compounded annually for the next decade, the stock is worth 112/share today – a 40% upside. See the math behind this dynamic DCF scenario.
Critical Details Found in Financial Filings by Our Robo-Analyst Technology
As investors focus more on fundamental research, research automation technology is needed to analyze all the critical financial details in financial filings. Below are specifics on the adjustments we make based on Robo-Analyst findings in Discover Financial Services 2018 10-K:
Income Statement: we made $737 million of adjustments, with a net effect of removing $269 million in non-operating expense (2% of revenue). You can see all the adjustments made to DFS’ income statement here.
Balance Sheet: we made $4.5 billion of adjustments to calculate invested capital with a net increase of $3.0 billion. One of the largest adjustments was $3.0 billion in to total reserves. This adjustment represented 27% of reported net assets. You can see all the adjustments made to DFS’ balance sheet here.
Valuation: we made $161 million of adjustments with a net effect of decreasing shareholder value by $161 million. There were no adjustments that increased shareholder value. The largest adjustment to shareholder value was $95 million in underfunded pensions. This adjustment represents <1% of DFS’ market cap. See all adjustments to DFS’ valuation here.
Most Dangerous Stocks Feature: Cardtronics Inc. (CATM: $28/share)
Cardtronics Inc. (CATM) is the featured stock from July’s Most Dangerous Stocks Model Portfolio.
From 2017 to the TTM period, CATM’s GAAP net income grew from -$145 million to $11 million. Economic earnings, on the other hand, fell from -$8 million to -$83 million over the same time, per Figure 2. NOPAT margin has fallen from 8% in 2017 to 5% TTM while ROIC fell from 6% to 4% over the same time.
Figure 2: CATM’s GAAP Net Income Rises as Economic Earnings Fall
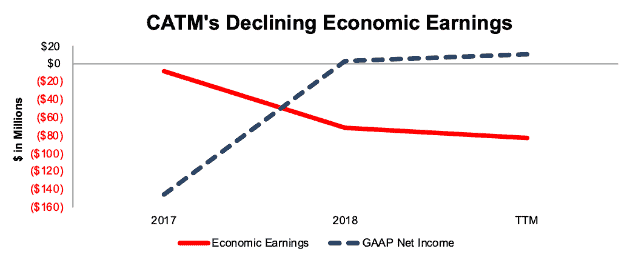
Sources: New Constructs, LLC and company filings
CATM Provides Poor Risk/Reward
Despite the deterioration in fundamentals, CATM is priced for significant profit growth and overvalued.
To justify its current price of $28/share, CATM must achieve 2018 NOPAT margins of 6% (compared to 5% TTM) and grow NOPAT by 10% compounded annually for the next 12 years. See the math behind this dynamic DCF scenario. This expectation seems overly optimistic given that CATM’s NOPAT declined by 22% compounded annually since 2016.
Even if CATM can maintain 2018 margins and grow NOPAT by 7% compounded annually for the next decade, the stock is worth only $14/share today – a 50% downside. See the math behind this dynamic DCF scenario.
Critical Details Found in Financial Filings by Our Robo-Analyst Technology
As investors focus more on fundamental research, research automation technology is needed to analyze all the critical financial details in financial filings. Below are specifics on the adjustments we make based on Robo-Analyst findings in Cardtronics’ 2018 10-K:
Income Statement: we made $112 million of adjustments, with a net effect of removing $70 million in non-operating expense (5% of revenue). You can see all the adjustments made to CATM’s income statement here.
Balance Sheet: we made $472 million of adjustments to calculate invested capital with a net increase of $450 million. One of the largest adjustments was $266 million in asset write-downs. This adjustment represented 20% of reported net assets. You can see all the adjustments made to CATM’s balance sheet here.
Valuation: we made $954 million of adjustments with a net effect of decreasing shareholder value by $953 million. The largest adjustment to shareholder value was $921 million in total debt, which includes $127 million in off-balance sheet operating leases. This lease adjustment represents 10% of CATM’s market cap. See all adjustments to CATM’s valuation here.
This article originally published on July 11, 2019.
Disclosure: David Trainer, Kyle Guske II, and Sam McBride receive no compensation to write about any specific stock, style, or theme.
Follow us on Twitter, Facebook, LinkedIn, and StockTwits for real-time alerts on all our research.
[1] Harvard Business School features the powerful impact of our research automation technology in the case New Constructs: Disrupting Fundamental Analysis with Robo-Analysts.
[2] This paper compares our analytics on a mega cap company to other major providers. The Appendix details exactly how we stack up.