
Recap From February’s Picks
Our Most Attractive Stocks (-3.3%) outperformed the S&P 500 (-3.8%) from February 3, 2022 through March 1, 2022 by 0.5%. The best performing large cap stock gained 1% and the best performing small cap stock was up 20%. Overall, 11 out of the 20 Most Attractive stocks outperformed the S&P 500.
Our Most Dangerous Stocks (-1.2%) underperformed the S&P 500 (-3.8%) as a short portfolio from February 3, 2022 through March 1, 2022 by 2.6%. The best performing large cap short stock fell by <1%, and the best performing small cap short stock fell by 7%. Overall, 5 out of the 14 Most Dangerous stocks outperformed the S&P 500 as shorts.
The Most Attractive/Most Dangerous Model Portfolios underperformed as an equal-weighted long/short portfolio by 1.1%.
More reliable & proprietary fundamental data, proven in The Journal of Financial Economics, drives our research and provides investors with a new source of alpha. Our proprietary Robo-Analyst Technology[1] scales our forensic accounting expertise (featured in Barron's ) across thousands of stocks[2] to produce an unrivaled database of fundamental data.
35 new stocks made our Most Attractive list this month, and 16 new stocks fell onto the Most Dangerous list. March’s Most Attractive and Most Dangerous stocks were made available to members on March 3, 2022.
Our Most Attractive stocks all have high and rising return on invested capital (ROIC) and low price to economic book value ratio. Most Dangerous stocks have misleading earnings and long growth appreciation periods implied by their market valuations.
Most Attractive Stocks Feature for March: Hanesbrands Inc. (HBI: $15/share)
Hanesbrands Inc. (HBI) is the featured stock from March’s Most Attractive Stocks Model Portfolio.
Hanesbrands has grown revenue by 4% compounded annually and net operating profit after-tax (NOPAT) by 5% compounded annually over the past 10 years.
Before the pandemic-driven disruptions to the company’s operations in 2020, the company’s NOPAT margin increased from 8% in 2010 to 13% in 2019, while ROIC rose from 12% to 14% over the same time.
Since the pandemic-related disruptions in 2020, Hanesbrands’ profitability has improved. The company’s NOPAT margin rose from 7% in 2020 to 10% in 2021, while invested capital turns rose from 1.0 to 1.1 over the same time. Rising NOPAT margin and invested capital turns drove Hanesbrands’ ROIC from 7% in 2020 to 11% in 2021.
Figure 1: Revenue & NOPAT Since 2007
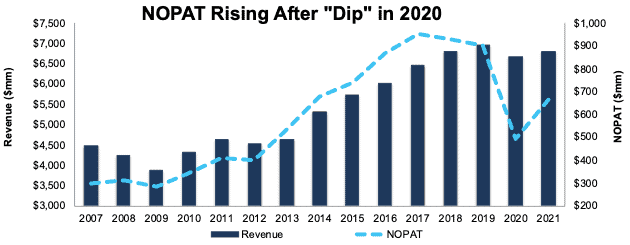
Sources: New Constructs, LLC and company filings
Hanesbrands Is Undervalued
At its current price of $15/share, HBI has a price-to-economic book value (PEBV) ratio of 0.5. This ratio means the market expects Hanesbrands’ NOPAT to permanently decline by 50%. This expectation seems overly pessimistic for a company that has grown NOPAT by 5% compounded annually over the past 10 years.
Even if Hanesbrands’ NOPAT margin falls to 7% (equal to 10-year low, compared to 10% in 2021) and the company’s NOPAT falls by 2% compounded annually for the next decade, the stock is worth $23/share today – a 53% upside. See the math behind this reverse DCF scenario. Should Hanesbrands grow profits more in line with historical levels, the stock has even more upside.
Critical Details Found in Financial Filings by Our Robo-Analyst Technology
Below are specifics on the adjustments we make based on Robo-Analyst findings in Hanesbrands’ 10-K:
Income Statement: we made $783 million in adjustments, with a net effect of removing $587 million in non-operating expense (9% of revenue). Clients can see all adjustments made to Hanesbrands’ income statement on the GAAP Reconciliation tab on the Ratings page on our website.
Balance Sheet: we made $2.9 billion in adjustments to calculate invested capital with a net increase of $1.2 billion. One of the most notable adjustments was $936 million in asset write-downs. This adjustment represented 20% of reported net assets. Clients can see all adjustments made to Hanesbrands’ balance sheet on the GAAP Reconciliation tab on the Ratings page on our website.
Valuation: we made $4.3 billion of adjustments with a net effect of decreasing shareholder value by $3.9 billion. Apart from total debt, one of the most notable adjustments to shareholder value was $243 million in underfunded pensions. This adjustment represents 5% of Hanesbrands’ market cap. Clients can see all adjustments to Hanesbrands’ valuation on the GAAP Reconciliation tab on the Ratings page on our website.
Most Dangerous Stocks Feature: KBR Inc (KBR: $53/share)
KBR Inc (KBR) is the featured stock from March’s Most Dangerous Stocks Model Portfolio.
KBR’s economic earnings, the true cash flows of the business, fell from -$44 million in 2018 to -$203 million in 2021. The company’s NOPAT margin fell from 6% to 3%, while ROIC fell from 7% to 3% over the same time.
Figure 2: Economic Earnings Since 2018
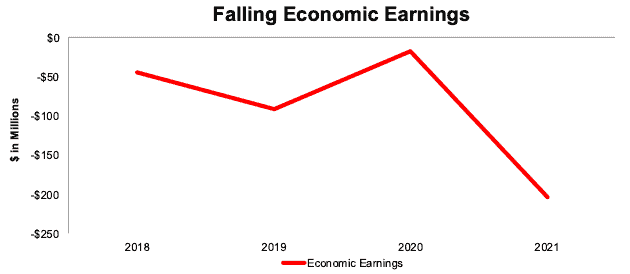
Sources: New Constructs, LLC and company filings
Despite its poor fundamentals, KBR is priced for significant profit growth, and we believe the stock is overvalued.
To justify its current price of $53/share, KBR must improve its NOPAT margin to 5% (five-year average, compared to 3% in 2021) and grow revenue by 8% compounded annually for the next decade. See the math behind this reverse DCF scenario. In this scenario, KBR grows NOPAT by 17% compounded annually over the next ten years. Given that KBR’s NOPAT fell 8% compounded annually over the past decade, we think these expectations are overly optimistic.
Even if KBR can achieve a NOPAT margin of 4% (three-year average) and grow revenue by 5% compounded annually for the next decade, the stock is worth just $31/share today – a 42% downside to the current stock price. See the math behind this reverse DCF scenario. Should KBR’s revenue grow at a slower rate, the stock has even more downside.
Each of these scenarios also assumes KBR can grow revenue, NOPAT, and FCF without increasing working capital or fixed assets. This assumption is unlikely but allows us to create truly best-case scenarios that demonstrate how high expectations embedded in the current valuation are.
Critical Details Found in Financial Filings by Our Robo-Analyst Technology
Below are specifics on the adjustments we make based on Robo-Analyst findings in KBR’s 10-K:
Income Statement: we made $176 million in adjustments, with a net effect of removing $170 million in non-operating income (2% of revenue). Clients can see all adjustments made to KBR’s income statement on the GAAP Reconciliation tab on the Ratings page on our website.
Balance Sheet: we made $2.5 billion in adjustments to calculate invested capital with a net increase of $1.4 billion. One of the most notable adjustments was $881 million in other comprehensive income. This adjustment represented 20% of reported net assets. Clients can see all adjustments made to KBR’s balance sheet on the GAAP Reconciliation tab on the Ratings page on our website.
Valuation: we made $2.3 billion in adjustments, with a net decrease to shareholder value of $2.3 billion. Apart from total debt, the most notable adjustment to shareholder value was $87 million in underfunded pensions. This adjustment represents 1% of KBR’s market cap. Clients can see all adjustments to KBR’s valuation on the GAAP Reconciliation tab on the Ratings page on our website.
This article originally published on March 11, 2022.
Disclosure: David Trainer, Kyle Guske II, and Matt Shuler receive no compensation to write about any specific stock, style, or theme.
Follow us on Twitter, Facebook, LinkedIn, and StockTwits for real-time alerts on all our research.
[1]Harvard Business School features our research automation technology in the case Disrupting Fundamental Analysis with Robo-Analysts.
[2]See how our models overcome flaws in Bloomberg and Capital IQ’s (SPGI) analytics in the detailed appendix of this paper.