
We closed KOSS on June 23, 2023. A copy of the associated Position Close report is here.
Our Focus List Stocks: Short Model Portfolio outperformed the S&P 500 as a short portfolio by 36% in 2021 with 29 out of our 31 picks outperforming the index. This is the last of three reports reviewing the biggest winners from this Model Portfolio last year and their potential returns for this year. We reviewed our worst performers from 2021 here.
Koss Corp (KOSS: $10/share) outperformed as a short in 2021 and we remain bearish on the stock. We also feature two other Focus List: Short stocks that outperformed in 2021, Peloton (PTON) here and Beyond Meat (BYND) here.
Focus List Stocks: Short Outperformed in 2021
The Focus List Stocks: Short Model Portfolio contains the best of our Danger Zone picks and leverages superior fundamental data, as proven in The Journal of Financial Economics[1], which provides a new source of alpha. This Model Portfolio is available in real-time to Pro and higher members, or you can purchase the current version of the Model Portfolio here.
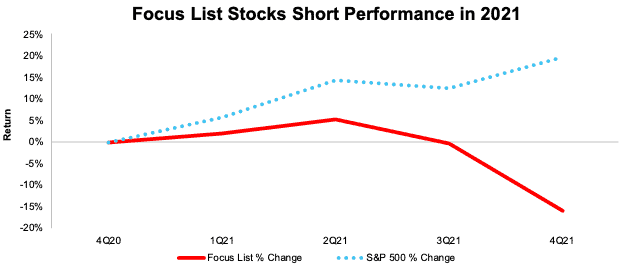
The Focus List Stocks: Short Model Portfolio fell, on average, -16% in 2021 compared to an average return of 20% for the S&P 500, per Figure 1[2].
Figure 1: Focus List Stocks: Short Model Portfolio Performance from Period Ending 4Q20 to 4Q21
Sources: New Constructs, LLC
Because our Focus List Stocks: Short Model Portfolio represents the best of the best picks, not all Danger Zone picks we publish make the Model Portfolio. We published 46 Danger Zone Reports in 2021 but added just 11 of those picks to the Focus List Stocks: Short Model Portfolio during the year. Currently, the Focus List Stocks: Short Model Portfolio holds 28 stocks.
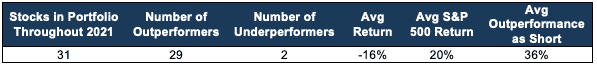
Figure 2 shows a more detailed breakdown of the Model Portfolio’s performance, which encompasses all the stocks that were in the Model Portfolio at any time in 2021.
Figure 2: Performance of Stocks in the Focus List Stocks: Short Model Portfolio in 2021
Sources: New Constructs, LLC
Performance includes the performance of stocks currently in the Focus List Stocks: Short Model Portfolio, as well as those removed during the year, which is why the number of stocks in Figure 2 (31) is higher than the number of stocks currently in the Model Portfolio (28).
Winner: Focus List Stock: Short: Koss Corp (KOSS): Down 54% vs. S&P 500 Up 13% Since Added to Focus List in 2021
We originally added Koss Corp to the Focus List Stocks: Short Model Portfolio in June 2021 and from that point through the end of 2021 it outperformed as a short by 67% in 2021. As the meme-stock rally ages, Koss remains significantly overvalued. We also warned investors of the risks of investing in other meme-stocks such as GameStop (GME), AMC Entertainment (AMC), and Express Inc. (EXPR).
Main Reason for Short Outperformance: Meme-Stock Rally Ran Out of Steam: Koss rose to popularity in January 2021 amongst the Wall Street Bets (WSB) Reddit crowd and was fully swept up in a meme-stock rally that saw its stock rise from $3/share to as high as $64/share. As with all the meme-stocks, Koss’ fundamentals had nothing to do with the stock’s rise. Once the meme-driven surge fizzled, Koss shares fell back to earth.
Why Koss Remains Very Unattractive: Business Cannot Justify Current Valuation: Even though Koss never traded based on its fundamentals, when we analyze its fundamentals, and juxtapose them with the expectations baked into the stock price, we see a large disconnect.
The retail dollar value of global headphone shipments has grown by 30% (vs -8% for KOSS) compounded annually since 2016. Meanwhile, Koss’s revenue has fallen 6% compounded annually over the same time.
Put another way, Koss’ revenue fell 28% while the retail dollar value of global headphone shipments rose 273% over the same time. If Koss can’t grow revenue in such a good environment, one must ask, when will it?
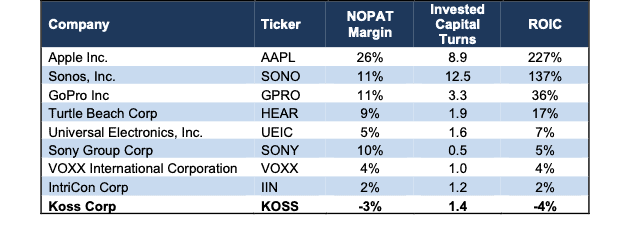
Koss’ revenue has been deteriorating for many years, and its profitably has lagged its competition as well. Of the competitors in Figure 3, Koss is the only company with negative NOPAT margin and ROIC. In fact, ROIC and NOPAT margin have been negative every year since 2016.
Figure 3: Profitability Metrics: Koss vs. Peers: TTM
Sources: New Constructs, LLC and company filings
Current Price Implies Profits 6x Previous Quarterly Record
We use our reverse discounted cash flow (DCF) model to quantify the expectations for future profit growth baked into the current stock price and see what the stock would be worth assuming more reasonable growth.
To justify $10/share, Koss must:
- immediately improve its profit margin to 4% (double its highest ever margin of 2% TTM vs. a 5-year average margin of -2%) and
- grow revenue by 24% compounded annually through fiscal 2027 (which is over 2x the projected industry growth over the same time, vs. Koss’ -6% CAGR over the past five years).
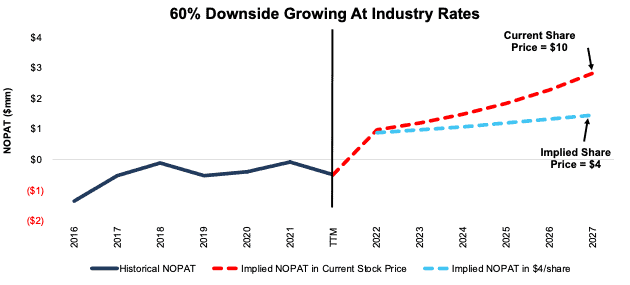
In this scenario, Koss earns $3 million in NOPAT in fiscal 2027, which would be the company’s first ever positive annual NOPAT and 6x its highest quarterly NOPAT ($0.5 million in fiscal 4Q21).
There is a 60%+ Downside If Growth Reaches Industry Average: In this scenario, Koss
- improves its profit margin to 4% and
- grow revenue by 11% compounded annually through fiscal 2027 (which is equal to the projected industry growth over the same time), then
the stock is worth just $4/share today – a 60% downside to the current price. If Koss’s revenue continues to fall, or it is unable to improve margins as assumed in the scenario above, the downside risk in the stock is even higher.
Figure 4 compares the firm’s historical NOPAT and implied NOPATs for the two scenarios we presented to illustrate just how high the expectations baked into Koss’ stock price remain.
Figure 4: Koss’ Historical and Implied NOPAT: DCF Valuation Scenarios
Sources: New Constructs, LLC and company filings
This article originally published on January 18, 2022.
Disclosure: David Trainer, Kyle Guske II, and Matt Shuler receive no compensation to write about any specific stock, sector, style, or theme.
Follow us on Twitter, Facebook, LinkedIn, and StockTwits for real-time alerts on all our research.
[1] Our research utilizes our Core Earnings, a more reliable measure of profits, as proven in Core Earnings: New Data & Evidence, written by professors at Harvard Business School (HBS) & MIT Sloan and published in The Journal of Financial Economics.
[2] Performance represents the price performance of each stock during the time in which it was on the Focus List Stocks: Short Model Portfolio in 2021. For stocks removed from the Focus List in 2021, performance is measured from the beginning of 2021 through the date the ticker was removed from the Focus List. For stocks added to the Focus List in 2021, performance is measured from the date the ticker was added to the Focus List through December 31, 2021.