We closed this Danger Zone pick on May 2, 2024. A copy of the associated Position Close report is here.
“I think the big takeaway is, fundamentals do not apply to retail traders,”
– Noah Williams, an Atlanta day trader featured in The Wall Street Journal’s GameStop Mania Reveals Power Shift on Wall Street – and the Pros Are Reeling
As more investors willfully admit they are gambling on stocks, we feel compelled to offer an easy way to make more informed decisions, and, hopefully, save people lots of money. Over the next few weeks, we’re going to give investors research that shows when meme stocks’ valuations get crazy, and they should sell. This week, we focus on Express Inc. (EXPR: ~$3.50/share) and put it in the Danger Zone. See our prior reports on GameStop (GME) and AMC Entertainment (AMC).
Why Investors Need Independent Research
Wall Street isn’t in the business of warning investors of the dangers in risky stocks because they make too much money from their trading volume and underwriting of debt and equity sales.
Only independent firms are free to provide unconflicted research and navigate Wall Street conflicts and analyst biases. With new technology to cut through the deluge of data in financial filings and overcome the flaws in Wall Street research, self-directed investors are better positioned than ever to make informed decisions.
What’s the Problem Here?
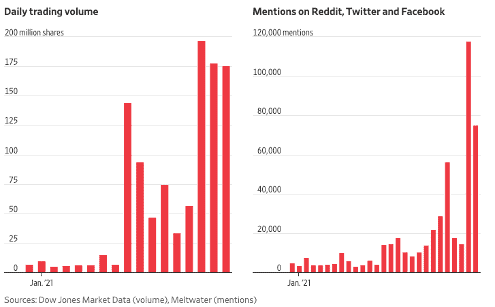
The meme stock frenzy highlights the lack of reliable fundamental research, which creates a vacuum for mis-information that elevates sources like Reddit or social media to undue levels of influence. Nothing illustrates the lack of fundamental perspective on meme stocks better than the correlation between stock prices and mentions across Reddit, Twitter, and Facebook. Figure 1 shows how Reddit, Twitter, and Facebook mentions of the poster-child meme stock, GameStop, soared in late January in lock step with the stock price. Express saw a similar trend, as daily trading volume averaged 54.6 million per day in January 2021, up from 4.3 million per day in December 2020. Trading volume peaked on January 25, 2021 at ~359 million.
Figure 1: GME Trading Volume Rises Alongside Mentions on Social Media
Image Source: Dow Jones Market Data (volume), Meltwater (mentions) via The Wall Street Journal
Meme Stock #3: Express Inc.: Danger Zone at Any Price
EXPR is not worth owning at any price, barring a drastic change in its business model, given the company’s poor fundamentals and improbability that equity holders will even see $1 of economic earnings.
With total debt $1.12 billion, including operating leases of $1.1 billion, at nearly 5x its market cap, Express’ equity investors are unlikely to ever lay claim to a penny of profits. Express’ economic book value, or the value of the business for equity holders based on today’s profits, is -$60/share and has not been positive in any year since fiscal 2015. The bottom line is that fundamentals, which are in decline, do not support a price over $1/share even with the most optimistic turnaround assumptions.
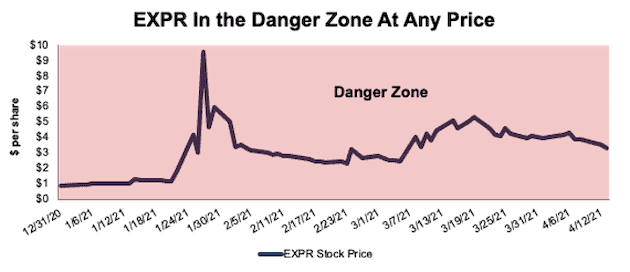
Nevertheless, the stock rose from ~$1/share to as high as $10/share in a single week of trading before taking a roller coaster path back to ~$4/share. See Figure 2.
Figure 2: Fundamental Research to Know When to Sell EXPR
Sources: New Constructs, LLC and company filings
Fundamentals Were Bad Even Before COVID-19
Express‘ profits have been deteriorating for many years, which illustrates how little the stock’s rise was related to the firm’s fundamentals.
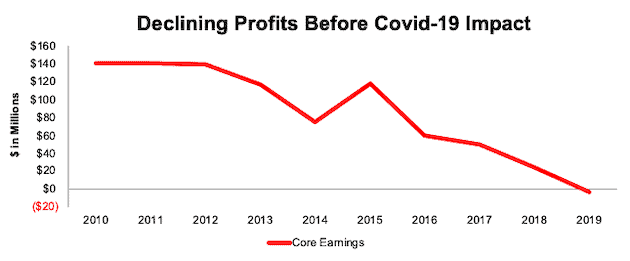
Express’ Core Earnings fell from $140 million in fiscal 2010 to -$4 million in fiscal 2019, per Figure 3. Core Earnings fell to -$337 million in fiscal 2020 (not in Figure 3 because they are so low that they throw off the y-axis scale). Express’ return on invested capital (ROIC) declined from 19% to 1% over the same time, and to -18% in fiscal 2020.
Given the poor fundamentals, EXPR earned an Unattractive rating before the meme-stock frenzy took off.
Figure 3: EXPR’s Core Earnings From Fiscal 2010-2019
Sources: New Constructs, LLC and company filings
Pre-Pandemic Headwinds Persist – Retail Apocalypse Victim
The COVID-19 pandemic exacerbated the ongoing trend of rising ecommerce sales and decline of brick-and-mortar, which is likely to persist post-pandemic.
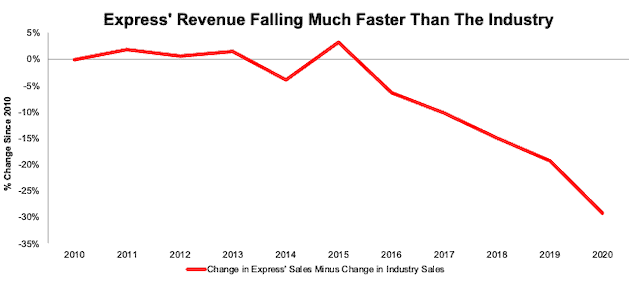
COVID-19 accelerated the demise of brick-and-mortar retailers like Express while underscoring the strength of omni-channel retailers, like Williams-Sonoma and Target. Figure 4 shows that Express was losing ground and underperforming before COVID-19, and its business only looked worse during COVID.
Figure 4 shows that Express’ revenue fell much faster (37% vs 7%) than all U.S. Clothing and Clothing Accessory Stores (“the industry”) over the last decade. Accordingly, Express’ market share fell from 0.9% in 2010 to 0.76% in 2019 and to 0.61% in 2020.
Figure 4: Difference in Change in Sales 2010-2020: Express vs. Clothing and Clothing Accessory Stores
Sources: New Constructs, LLC and U.S. Census Bureau
Poor fundamentals and structural headwinds, however, didn’t stop Express’ stock from soaring during the meme-stock frenzy. To give readers a sense of just how crazy overvalued the stock was at its peak, we do the math and show how the business would have to perform to justify $10/share.
“Crazy” at $10 Explained: Implies More Revenue Than Abercrombie & Fitch
Our reverse discounted cash flow (DCF) model is an excellent research tool for analyzing the expectations implied by stock prices. To justify $10/share, it shows that Express must:
- immediately improve its profit margin to 6% (equal to Express’ pre-COVID 10-year average, compared to 1% in fiscal 2019 before the pandemic) and
- grow revenue by 14% compounded annually through 2030 (which assumes revenue grows by consensus estimates in fiscal 2021 and 2022 and 11% each year thereafter, which is higher than fiscal 2022 estimates of 9% revenue growth)
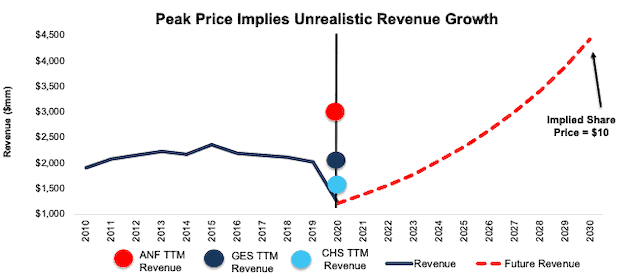
In this scenario[1], Express earns ~$4.4 billion in revenue in fiscal 2030, which is ~187% of its previous record high revenue in fiscal 2015 and more than the trailing-twelve-months (TTM) revenue of Abercrombie & Fitch (AEO), Guess Inc., (GES), and Chico’s FAS (CHS). See Figure 5 for details. For reference, Express’ revenue fell by 1% compounded annually in the five years before COVID-19.
Figure 5: Express’ Historical Revenue vs. DCF Implied Revenue: Scenario 1
Sources: New Constructs, LLC and company filings
Still Crazy At ~$3.50/share
For perspective on the current price, we run the same analysis to show what the company must do to justify ~$3.50/share:
- immediately improve its profit margin to 6% (equal to Express’ pre-COVID 10-year average vs. 1% in fiscal 2019) and
- grow revenue by 10% compounded annually through fiscal 2030 (which is greater than fiscal 2022 consensus estimate of 9%)
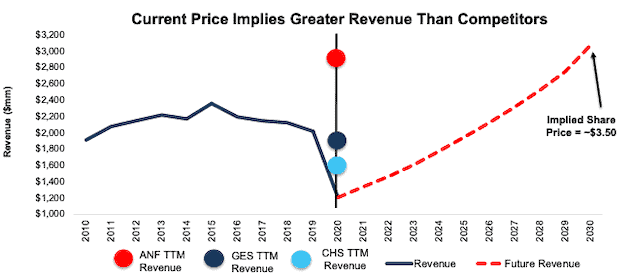
In this scenario, Express earns over $3.1 billion in revenue in fiscal 2030, which is 33% higher than Express’ record revenue of $2.4 billion in fiscal 2015 and above the TTM revenue of peers such as Abercrombie & Fitch Guess, and Chico’s FAS. See Figure 6 for details.
Figure 6: Express’ Historical Revenue vs. DCF Implied Revenue: Scenario 2
Sources: New Constructs, LLC and company filings
Lagging Profitability Makes Valuation Look Even More Unlikely
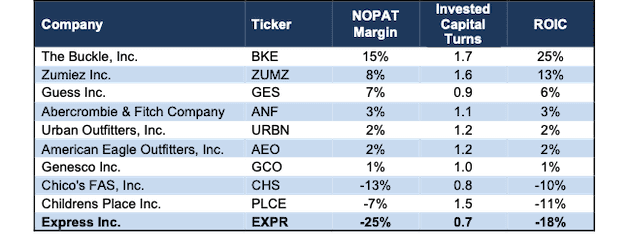
Base on the scenarios above, to simply justify its current stock price, Express must drastically improve profitability while also growing revenue to levels well above many of its peers. Such a scenario looks even less likely when comparing Express’ current fundamentals vs. the peers listed in its proxy statement. Per Figure 7, Express has the lowest NOPAT margin, invested capital turns, and ROIC of its peers.
Figure 7: Profitability Metrics: Express vs. Peers: TTM
Sources: New Constructs, LLC and company filings
High Short Interest Was Warranted
Prior to the meme stock rally in January, ~12% of Express’ float was sold short, which seems warranted given the firm’s poor fundamentals and structural headwinds facing the industry. Now, there are currently 5.4 million shares sold short, which equates to ~9% of its float sold short. Although short interest is in decline, the roller coaster stock price has not scared off many investors that believe Express’ best days are behind it.
More Reliable Fundamental Research on other Meme Stocks
With a better grasp on fundamentals[2], investors have a better sense of when to buy and sell – and – know how much risk they take when they own a stock at certain levels.
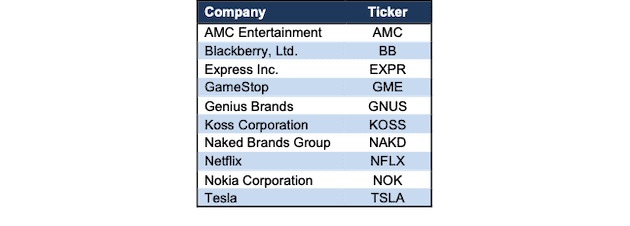
We’ve already illustrated the extreme risk investors are taking buying GameStop and AMC Entertainment. In the coming weeks, we will continue to perform this same analysis on other meme stocks: Blackberry (BB), Genius Brands (GNUS), Koss Corporation (KOSS), Naked Brands Group (NAKD), and Nokia (NOK). Each of these stocks were on Robinhood’s restricted stocks list and each saw a major rise and fall in late January.
We will also feature other meme stocks that trade at levels entirely disconnected from fundamental reality, such as Netflix (NFLX) and Tesla (TSLA).
Figure 8: Meme Stocks Disconnected From Fundamental Reality
Sources: New Constructs, LLC and company filings
Check out this week’s Danger Zone interview with Chuck Jaffe of Money Life.
This article originally published on April 19, 2021.
Disclosure: David Trainer, Kyle Guske II, Alex Sword, and Matt Shuler receive no compensation to write about any specific stock, style, or theme.
Follow us on Twitter, Facebook, LinkedIn, and StockTwits for real-time alerts on all our research.
[1] All dates in these reverse DCF scenarios refer to the year in which the firm files it’s 10-K, which may differ from the year Express uses to describe its fiscal year. For instance, in our reverse DCF model, EY 10: 2031 would refer to what Express would call fiscal 2030.
[2] Only Core Earnings enable investors to overcome the inaccuracies, omissions and biases in legacy fundamental data and research, as proven in Core Earnings: New Data & Evidence, a forthcoming paper in The Journal of Financial Economics written by professors at Harvard Business School (HBS) & MIT Sloan.
