We closed MMP on May 26, 2023. A copy of the associated Position Close report is here.
This pipeline system operator offers low-cost, low-carbon, and high-volume transportation to half of U.S. refinery capacity. Better yet, the company’s ability to consistently adjust its tariffs means it is well positioned to deliver strong cash flows even in a high inflation environment. Magellan Midstream Partners LP (MMP: $49/unit) is this week’s Long Idea.
MMP presents quality risk/reward given the company’s:
- position to benefit from decades of continued demand for refined products and crude oil
- middleman positioning as a transportation network provides stable earnings in a cyclical industry
- strong free cash flow (FCF) generation to fund its 8.8% dividend yield
- operations are safer and cheaper than competing transportation providers
- superior profitability to peers
- units are worth $67+ even if profits never reach 2018 levels
Refined Products Demand Will Persist in the U.S.
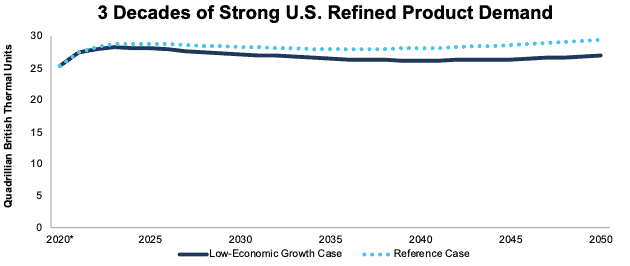
According to the U.S. Energy Information Administration’s (EIA) 2022 Annual Energy Outlook (AEO), U.S. demand for refined products[1] will remain strong over the next three decades. Even in the pessimistic low growth scenario below, the EIA forecasts refined product consumption will fall just 2% from 2021 to 2050. See Figure 1.
Notably, the EIA’s reference case projects refined product demand will grow 7% by 2050.
Figure 1: EIA’s U.S. Refined Products Consumption Forecast: Low Growth Scenario Through 2050
Sources: New Constructs, LLC and EIA
*2020 value taken from EIA’s 2021 AEO
Magellan’s Middleman Advantage
Revenue for fossil fuel exploration and production companies is typically cyclical and very dependent on oil and natural gas prices. Except for the supermajors, which operate across the entire energy vertical, energy producing companies either boom or bust based on commodity prices. In contrast, Magellan is less affected by oil and natural gas price fluctuations because the company manages a tariff-collecting business in the middle of the supply chain. The company is shielded from the full volatility of commodity markets by the need for production companies and refiners to get their products to their respective customers.
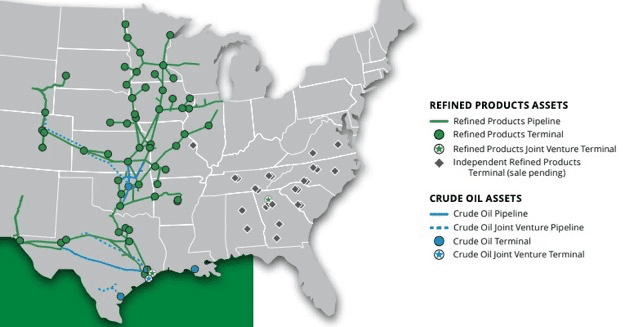
Magellan operates the largest common carrier[2] refined products pipeline system in the United States, and revenue from the its refined products segment accounted for 77% of its total revenue in 2021. Pipeline systems, such as Magellan’s, offer the most reliable, lowest cost, least carbon intensive, and safest transportation method for crude oil and refined products. Magellan’s footprint gives it access to nearly 50% of U.S. refining capacity.
Per Figure 2, Magellan’s pipeline system connects refineries in America’s Midwest to various end markets and the Houston Ship Channel.
Figure 2: Magellan’s Refined Products and Crude Oil Assets
Source: New Constructs, LLC and Investor Relations
Network Effect Is a Competitive Advantage
Refined products pipeline volumes are driven by demand from connected markets, which contrasts with crude-oil pipeline systems, whose volumes are dependent on supply levels. Except for pandemic-related lockdowns, the consumption of hydrocarbons is very stable. In contrast, the demand for crude fluctuates because refiners vary their sourcing of crude oil from their inventories or domestic and international producers. That variance can result in large swings in crude pipeline usage over time. Accordingly, a refined product pipeline system offers more volume stability, which translates to revenue stability for a tariff-driven business.
The breadth of Magellan’s pipeline system provides a strong network effect that offers more optionality to its customers and serves as a large competitive advantage over other refined product delivery systems that cannot offer the same flexibility.
Middleman Advantage Drives Consistent Cash Flows and Funds Large Distributions
Magellan’s tariff-based transportation system supports the company’s unit distribution, which, when annualized, provides an 8.8% yield. Magellan has paid a distribution in every year since 2011. Since 2017, Magellan has paid $4.4 billion (41% of current market cap) in cumulative dividends.
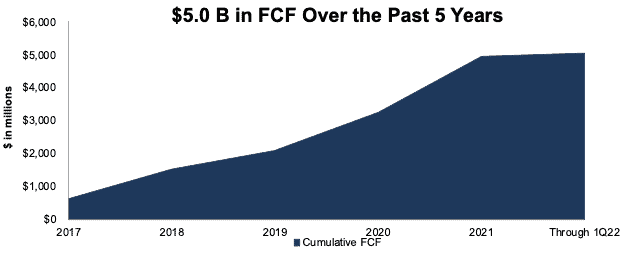
Magellan generates significant cash flow that supports the company’s high distribution yield. Per Figure 3, over the past five years, Magellan generated $5.0 billion (47% of market cap) in free cash flow (FCF).
In addition, Magellan’s contracts include “take-or-pay” provisions which guarantee customers pay for a minimum amount of capacity, whether they use it or not. These provisions offset the risk of fluctuating demand. During the COVID-19 pandemic, the transportation sector’s consumption of petroleum products fell 15% year-over-year (YoY) in 2020, whereas Magellan’s revenue declined by just 11% while its FCF rose by 104% YoY.
Figure 3: Magellan’s Cumulative Free Cash Flow Since 2017
Sources: New Constructs, LLC and company filings
Transition to EVs Will Take Decades and Decades
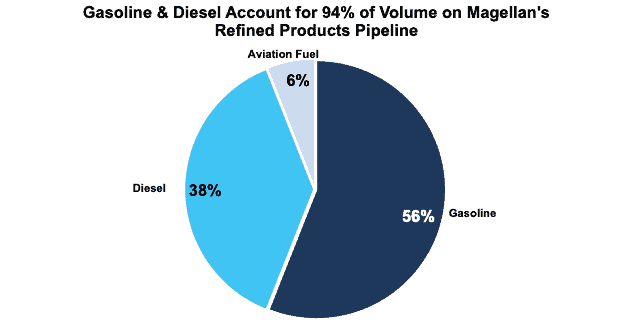
Bears may be quick to dismiss Magellan due to its strong ties to the demand of internal combustion engine (ICE) vehicles. Per Figure 4, 94% of the refined products Magellan transports are diesel and gasoline.
Figure 4: Percent of Total Refined Products Transported on Magellan’s Pipeline: 2021
Source: New Constructs, LLC and company filings
However, as we showed in Vive la Hydrocarbons, Vive la Petrochemicals, even if the world adopts electric vehicles (EVs) in line with the EIA’s expectations, there will still be ~15% more ICE vehicles on the road in 2050 than in 2020. In addition, analysis on the EV market frequently ignores the number of diesel-fueledheavy engines needed to dig the minerals for batteries out of the ground and move the components back and forth during refining and manufacturing.
Magellan’s physical footprint should also alleviate concerns of a speedy EV transition. The company largely operates in parts of the country that have been slow to adopt EVs.
Even if the U.S. as a whole transitions to EVs faster than the rest of the world, Magellan’s access to the Houston Ship Channel could help inland refineries offset declining domestic demand by increasing exports.
An Overlooked ESG Winner
An increased focus on decarbonization in the Energy sector will drive demand for pipeline capacity, given that it offers the least carbon-intensive form of long-haul transportation. Additionally, pipelines are safer than other forms of refined products transportation, as they destroy less property and cause fewer deaths than trucking and rail transporters.
Governmental resistance to expanding the current pipeline system in the U.S. due to other environmental concerns means the barriers to entry for potential competitors are growing. As an established player with access to key production and consumption regions, Magellan stands to benefit from any limits on new pipelines.
Renewables Need Transportation and Blending Facilities, Too
Over the short-to-medium term, regulatory promotion of renewable fuels such as biodiesel and ethanol threaten the volume of refined products available for Magellan to transport on its pipeline network, as most renewables are transported by rail, truck, or barge. However, these other transportation methods still rely on Magellan’s terminals to store, blend, and distribute renewables into the fuel stream.
As renewables become a larger part of the refined product mix, we expect Magellan will increase the renewable capacity of its pipeline system. Once again Magellan’s physical footprint provides a competitive advantage because it is located in the primary renewable fuel production areas of the country. Over the long term, Magellan’s outlook for volume (renewables or other) shipments on its pipeline system is strong.
Tariff Increases Will Offset Inflationary Pressure
Magellan is better equipped than most companies to deal with a high-inflation environment. As a low-cost provider, the company has more room to adjust pricing upwards than more expensive transports do. The company expects the average tariff to increase 6% by July 2022.
Furthermore, 30% of Magellan’s tariff caps are tied to the Federal Energy Regulatory Commission (FERC) oil index which will increase to 1.09 on July 1 – up from 0.98 over the prior year. Magellan’s ability to increase tariffs demonstrates its competitive strength in the market and insulates the company from many of the effects of inflation.
Magellan Is Less Exposed to Labor Market Than Others
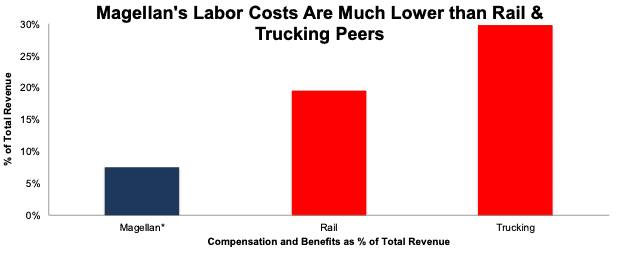
Magellan’s general and administrative (G&A) expense (which includes labor costs) as a percent of revenue is much lower than its trucking and rail peers[3]. Figure 5 shows that in 2021, Magellan’s G&A (inclusive of compensation and benefit costs) as a percent of total revenue of 8% was much lower than the compensation and benefit costs as a percent of total revenue of 20% for rail peers and 30% for trucking peers. Magellan’s cost-efficient operation will enable it to continue to provide relatively low-cost tariffs as its peers are forced to increase shipping rates to offset rising labor costs.
Figure 5: Compensation and Benefit Costs: Magellan Vs. Peers: 2021
Sources: New Constructs, LLC and company filings
*General and administrative expense (inclusive of compensation and benefits) / total revenue
Self-Driving Tanker Trucks Face Technological, Logistical, and Safety Concerns
As labor costs comprise such a large percentage of a tucking operators’ expense, the adoption of self-driving tanker trucks would make road transportation much more competitive with a pipeline system. However, the adoption of self-driving tanker trucks faces numerous challenges. To begin, urban environments, bad weather conditions, and lack of 5G connectivity challenge current self-driving technology.
Pipelines accounted for 77% of all petroleum product transportation in the U.S. in 2021. Should automated trucking increase the volume of refined products on highways, concerns over the danger of transporting such hazardous materials through communities would likely rise quickly. The controversies surrounding crude-by-rail and the destruction of nearly an entire town in Canada in 2013 would pale in comparison to the squabble over deaths caused by automated fuel trucks. Eliminating drivers doesn’t remove all the risk of tanker truck accidents. According to the Federal Motor Carrier Safety Administration (FMSCA), 22% of cargo tank rollovers do not involve driver error.
Pipelines are much safer and can be routed away from densely habituated areas that road and rail corridors frequently pass right through.
Concerns Over Excess Permian Pipeline Capacity Are Overblown
Magellan has felt the impact of a surge in new pipeline capacity from the Permian basin over the past two years. Volume shipped on 100%-owned Magellan crude pipelines fell from 317 million barrels in 2019 to just 190 million barrels in 2021. Increased capacity from the Permian Basin has also driven down the rates Magellan can charge on the pipelines it operates in this region. Lower volumes and lower tariffs drive lower operating profit from the crude oil segment, which fell from $493 million in 2019 to just $305 million in 2021.
The company has options if the Permian crude oil transportation market remains overserviced. Magellan is evaluating the possibility of converting the company’s 100%-owned, Permian-based Longhorn pipeline to a Houston to El Paso refined products pipeline, which could expand Magellan’s reach to markets in Arizona and Mexico. We believe the company’s handling of the Longhorn pipeline shows the flexibility of its capital and business plan, which are not fully appreciated by the market. An underappreciation of the value of the firm’s franchise is what the market is missing about this company and others like it.
More Profitable Than Other Pipeline Peers
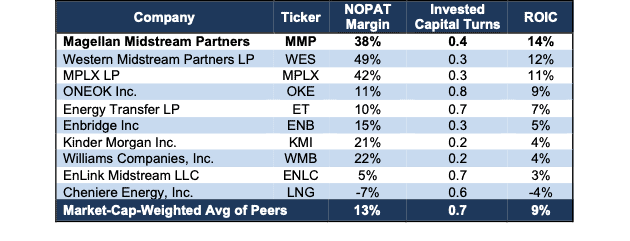
Despite the recent volume declines in its crude oil segment, Magellan is more profitable than its pipeline peers. The company’s return on invested capital (ROIC) of 14% over the TTM is tops among peers, which include Enbridge (ENB), Kinder Morgan (KMI), and Williams Companies (WMB). See Figure 6.
Figure 6: Magellan’s Profitability Vs. Pipeline Peers: TTM
Sources: New Constructs, LLC and company filings
Tariff-Focused Business Drives Consistent Core Earnings
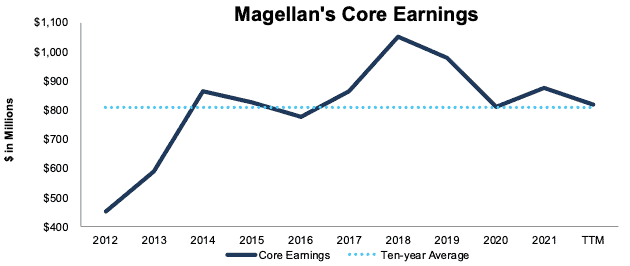
Magellan’s tariff-centered pipeline system helped the company generate positive Core Earnings in each of the past 10 years. Core Earnings grew from $451 million in 2012 to $876 million in 2021, or 8% compounded annually. While the company’s Core Earnings over the TTM are lower at $818 million, the tariff increases that the company will implement in July 2022 should send profits higher in the second half of the year.
Figure 7: Magellan’s Core Earnings Since 2012
Sources: New Constructs, LLC and company filings.
Cheap Valuation and Buybacks Offset MLP Risk
Of course, the big risk with MLPs is that the general partner operating the MLP might have interests that conflicts with those of the unitholders. As a result of this structural concern, we give all master limited partnerships (MLPs) a suspended Stock Rating since the complex nature of MLP agreements could potentially cause significant unitholder dilution.
Unlike other MLPs, Magellan’s general partner operates no other business, which reduces much of this risk to unitholders. Importantly, rather than being diluted, Magellan’s unitholders have seen their share of ownership in the company grow since 2012 as the company’s unit count has fallen from 228 million in 2015 to 212 million in 1Q22. In other words, unitholders have gained 7% more of the company since 2015. Looking ahead, unitholders can expect buybacks to continue. The company authorized an additional $750 million of unit repurchases through December 2024. Should the company use all of its authorization, it would buyback ~16 million more units at today’s price.
Despite the strength of Magellan’s business model and favorable distributions to unitholders, investors price MMP at a discount compared to its non-MLP peers. Figure 8 compares the price-to-economic book value (PEBV) ratio of Magellan to its pipeline peers that are not organized as an MLP, which include ONEOK (OKE), Enbridge, Kinder Morgan, and Williams Companies.
Figure 8: Magellan’s PEBV Ratio Vs. non-MLP Pipeline Peers: TTM
Sources: New Constructs, LLC and company filings
Below, we use our reverse discounted cash flow (DCF) model to quantify the expectations baked into Magellan’s stock price, as well as the upside potential in units should the company exhibit only moderate profit growth in the coming years.
DCF Scenario 1: to Justify the Current Stock Price.
We assume Magellan’s:
- NOPAT margin remains at its TTM level of 38% (vs. 5-year average of 43%) in 2022 through 2046 and
- revenue falls 25% from 2021 - 2046 (vs. EIA’s 2022 AEO Refined Products Low-Growth Scenario decline of 4% from 2021 - 2046)
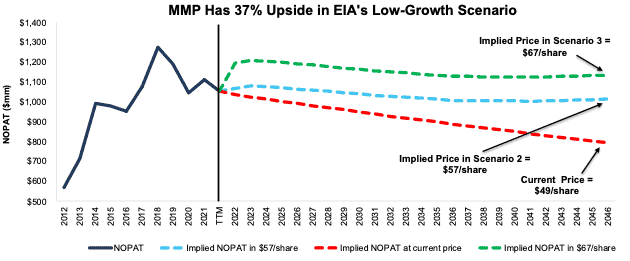
In this scenario, Magellan’s NOPAT falls 1% compounded annually over the next 25 years and the stock is worth $49/unit today – equal to the current price. In this scenario, Magellan earns $796 million in NOPAT in 2046, which is 25% below TTM levels and 20% below its 10-year average NOPAT.
DCF Scenario 2: Units Are Worth $57+.
If we assume Magellan’s:
- NOPAT margin remains at its TTM level of 38% and
- revenue falls at a 4% CAGR through 2046, in line with the EIA’s 2022 AEO Refined Products Low-Growth Scenario, then
MMP is worth $57/unit today – a 16% upside to the current price. In this scenario, Magellan’s NOPAT falls to $1.0 billion in 2046, or 2% below TTM levels. In this scenario, Magellan’s ROIC in 2046 is just 11%, which is well-below its 10-year average ROIC of 16%. Should Magellan’s ROIC remain in line with historical levels, the stock has even more upside.
DCF Scenario 3: More Upside Should Margins Return to 5-Year Average
Each of the above scenarios assumes Magellan’s NOPAT margin remains at TTM levels. However, management anticipates the company will be able to consistently increase tariffs for the foreseeable future, which will likely result in a higher NOPAT margin.
If we assume Magellan’s:
- NOPAT margin improves to its 5-year average of 43% from 2022-2046 and
- revenue falls in line with the EIA’s 2022 AEO Refined Products Low-Growth Scenario through 2046, then
MMP is worth $67/unit today – a 37% upside to the current price. In this scenario, Magellan’s NOPAT in 2046 is $1.1 billion, or equal to TTM levels. This scenario assumes the EIA’s most pessimistic economic assumptions, should the economy grow at a higher rate, the stock has even more upside.
Figure 9 compares Magellan’s historical NOPAT to the NOPAT implied in each of the above DCF scenarios.
Figure 9: Magellan’s Historical and Implied NOPAT: DCF Valuation Scenarios
Sources: New Constructs, LLC and company filings.
Each of the above scenarios includes a terminal value that assumes revenue permanently remains at $1.0 billion after 2046, or 50% below 2046 levels and 63% below TTM levels. Additionally, these scenarios assume Magellan is unable to offset volume declines with tariff increases. If demand for refined products beyond 2046 remains stronger than this assumption, or Magellan is able to increase tariffs over the long term, the stock has even more upside.
Sustainable Competitive Advantages Will Drive Unitholder Value Creation
Here’s a summary of why we think the moat around Magellan’s business will enable it to continue to generate higher NOPAT than the current market valuation implies. The following competitive advantages also help Magellan generate strong cash flows for decades to come:
- superior network effects than competitors
- lowest cost and carbon footprint among available transport methods
- high profitability compared to peers
What Noise Traders Miss with Magellan
These days, fewer investors focus on finding quality capital allocators with unitholder friendly corporate governance. Instead, due to the proliferation of noise traders, the focus is on short-term technical trading trends while more reliable fundamental research is overlooked. Here’s a quick summary of what noise traders are missing:
- the persistence of refined product demand
- inflationary protection from Magellan’s tariff-based operation
- valuation implies MMP is much cheaper than the stocks of other pipeline peers
Earnings Beats and Sustained Inflation Could Send Units Higher
Magellan has beaten earnings estimates in 11 of the past 12 quarters and doing so again could send units higher.
While the high-inflation environment negatively impacts most businesses, Magellan’s tariff-based operation is positioned to deliver strong earnings and cash flows in most economic environments. Should investors become increasingly drawn to Magellan’s steady performance and high distribution yield as other businesses struggle, this neglected stock could see its units soar as investors hedge against inflation and the threat of a recession.
Distributions and Unit Repurchases Could Provide 14.1% Yield
As previously mentioned, Magellan returns capital to unitholders through distributions and unit repurchases. In 2021, the company repurchased $525 million worth of units. Should the company purchase an additional $525 million worth of units (well below its additional authorization of $750 million) in 2022, the buybacks would provide an annual yield of 5.3% at its current market cap. Combined with a distribution yield of 8.8%, investors would see a 14.1% yield on their units.
Executive Compensation Could Be Improved
No matter the macro environment, investors should look for companies with executive compensation plans that directly align executives’ interests with unitholders’ interests. Quality corporate governance holds executives accountable to unitholders by incentivizing them to allocate capital prudently.
The company compensates executives through base salaries, cash bonuses, performance-based equity awards, and time-based equity awards. Cash bonuses are tied to distributable cash flow or “Adjusted EBITDA”, which equals EBITDA less Maintenance Capital and environmental, safety, and culture performance metrics.
Performance-based awards are tied to target thresholds for non-GAAP distributable cash flow, which equals Adjusted EBITDA less net interest expense (excluding debt issuance cost amortization) less maintenance capital. Tying executive compensation to non-GAAP distributable cash flow is problematic given how misleading the metric can be. It does not hold management accountable for real expenses such as depreciation and amortization and executive compensation or any expense related to the company’s balance sheet.
Instead of non-GAAP metrics like Adjusted EBITDA and distributable cash flow, we recommend tying executive compensation to ROIC, which evaluates the company’s true returns on the total amount of capital invested in the company, and ensures that executives’ interests are actually aligned with unitholders’ interests as there is a strong correlation between improving ROIC and increasing shareholder value.
Despite room for improving its executive compensation plan, Magellan has grown economic earnings from $407 million in 2012 to $725 million over the TTM.
Insider Trading and Short Interest Trends
Over the past 12 months, insiders have not made any purchases and have sold 22 thousand shares. These sales represent less than 1% of shares outstanding.
There are currently 6.6 million units sold short, which equates to 3% of units outstanding and just under six days to cover. Short interest is down 8% from the prior month. The lack of short interest reveals not many are willing to take a stake against this free cash flow generator.
Critical Details Found in Financial Filings by Our Robo-Analyst Technology
Fact: we provide more reliable fundamental data and earnings models – unrivaled in the world.
Proof: Core Earnings: New Data & Evidence, forthcoming in The Journal of Financial Economics.
Below are specifics on the adjustments we make based on Robo-Analyst findings in Magellan’s 10-K and 10-Qs:
Income Statement: we made $386 million of adjustments, with a net effect of removing $131 million in non-operating expenses (5% of revenue). Clients can see all adjustments made to Magellan’s income statement on the GAAP Reconciliation tab on the Ratings page on our website.
Balance Sheet: we made $949 million of adjustments to calculate invested capital with a net increase of $331 million. One of the largest adjustments was $315 million in discontinued operations. This adjustment represented 4% of reported net assets. Clients can see all adjustments made to Magellan’s balance sheet on the GAAP Reconciliation tab on the Ratings page on our website.
Valuation: we made $6.0 billion of adjustments to unitholder value for a net effect of decreasing unitholder value by $5.7 billion. Apart from total debt and the discontinued operations mentioned above, one of the most notable adjustments to unitholder value was $147 million in underfunded pensions. This adjustment represents 1% of Magellan’s market cap. Clients can see all adjustments to Magellan’s valuation on the GAAP Reconciliation tab on the Ratings page on our website.
Attractive Fund That Holds MMP
The following fund receives our Attractive rating and allocates significantly to MMP:
- InfraCap MLP ETF (AMZA) – 16.7% allocation
This article originally published on June 22, 2022.
Disclosure: David Trainer, Kyle Guske II, and Matt Shuler receive no compensation to write about any specific stock, style, or theme.
Follow us on Twitter, Facebook, LinkedIn, and StockTwits for real-time alerts on all our research.
[1] For the purposes of this analysis, refined products includes motor gasoline, distillate fuel oil (i.e. diesel), and jet fuel.
[2] According to McKinsey, common carrier refers to any pipeline that offers transportation services to any third party under a standard set of terms. This arrangement contrasts with a private or proprietary pipeline that is either used by the owner for internal purposes or contracted to only a limited set of users.
[3] For this report, rail peers include Union Pacific Corp (UNP), Canadian National Railway (CNI), and CSX Corporation (CSX). Trucking peers include Old Dominion Freight Line, Inc. (ODFL), J.B. Hunt Transport Services, Inc. (JBHT), and Knight-Swift Transportation Holdings, Inc. (KNX).

