This bull market is getting long in the tooth. Both reported and economic earnings are declining, and weak first quarter economic data has economists starting to utter the dreaded R-word, recession. While no one outside of the usual doom and gloom crowd is saying a downturn is imminent, many economic indicators do seem to suggest that the economic recovery could be on its last legs.
This is not to say that investors should be running for the hills, but now might be a good time to start reducing the risk in your portfolio. We’ve identified a company that should hold up well in the case of an economic downturn while also presenting significant upside to investors: Sally Beauty Holdings (SBH: $32/share).
Sally Beauty operates in an industry that tends to be recession-proof. What’s more, its cheap valuation and recent changes to executive compensation position the stock to outperform in the long term.
Cosmetics Are Recession-Proof
When times are tough, people tend to spend less on discretionary consumer items: entertainment, going out to eat, new cars, etc. The only things they don’t seem to cut back on are beauty supplies. There have been multiple examples dating back to the Great Depression of women actually increasing their purchases of cosmetics when times are tough. Both Sally Beauty and competitor Ulta (ULTA) made it through the most recent recession with little-to-no disruption of sales or profits.
Current projections have the global cosmetics market growing by 6.4% over the next five years. Solid growth potential combined with low risk make the cosmetics industry an attractive place to invest, and Sally Beauty represents the best value in the industry.
Higher Earnings Quality Than Meets the Eye
We like companies that don’t play games with the accounting numbers. That’s why we love seeing the tight correlation between GAAP net income and economic earnings for Sally Beauty since it spun off from Alberto-Culver in 2006.
Figure 1: GAAP Net Income & Economic Earnings Are Growing Steadily
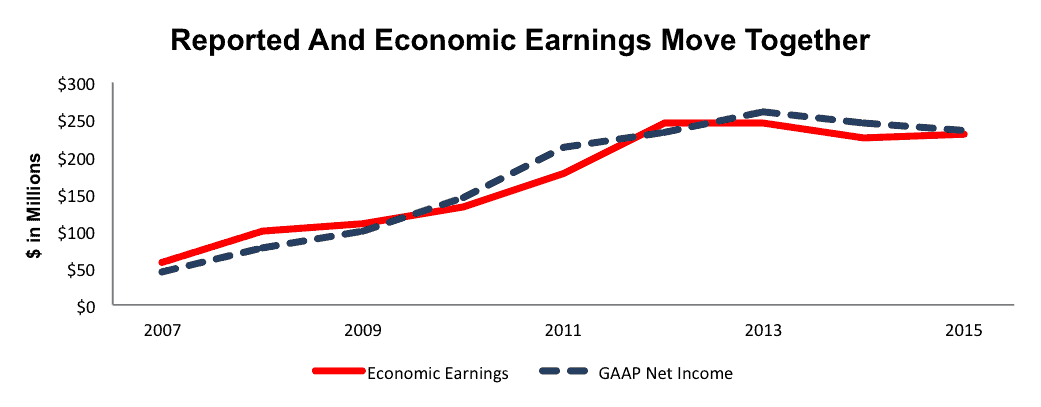
Sources: New Constructs, LLC and company filings
In fact, GAAP net income actually understates Sally Beauty’s profits over the past year. The company had $13.5 million in pretax non-operating expenses hidden in operating income. These came from write-downs, closing stores in Germany, and one-time costs related to a data breach the company experienced in late 2014.
Adjusting out these non-recurring costs shows that, while GAAP net income declined last year, economic earnings are on the rise. Sally Beauty is operating at a higher level of profitability than the market believes.
Advantages Of The Multi-Channel Platform
Sally Beauty operates in two distinct segments. Its Sally Beauty Supply segment operates roughly 3,700 retail stores throughout the U.S., Latin America, and Europe. The Sally Beauty Supply segment accounted for 61% of revenue in 2015.
The other segment, Beauty Systems Group (BSG), sells directly to salons and salon professionals through a network of around 1,300 stores and 1,000 professional distributor sales consultants. This segment has slightly lower operating margins but has been growing at a higher rate in recent years.
With its multi-channel distribution platform, Sally Beauty can reach a wide array of consumers in the fragmented beauty market. In the U.S., the 50 largest beauty salon operators account for just 15% of revenue. The remaining 85% comes from the tens of thousands of small-scale salons that are often owned and operated by a single individual.
Sally Beauty has the largest cosmetic distribution network in the country, giving it an inherent advantage at reaching this fragmented market. By operating through multiple channels, it can benefit from the high margins of its retail stores while still reaching the lucrative salon professional customers.
Compelling Store Economics
Sally Beauty Supply operates small stores that are extremely capital efficient. The typical store space is just 1,700 square feet, 90% of which is devoted to merchandise. This small space allows for a low capital expenditure. The average store requires just $70 thousand in capital investment to start up.
With such a low initial capital requirement, these stores generate a positive return quickly. On average they have a positive contribution margin after 4 months and pay back the entire initial investment within two years.
The low capital requirements help Sally Beauty earn a top-quintile return on invested capital (ROIC) of 16%, better than Ulta at 13%. They also help the company continue to grow its store count while still generating positive free cash flow in every single year since it was spun off.
Bears Overstate The Threat Of Competition
The biggest concern among bears for Sally Beauty has been the threat of competition from rapidly growing Sephora and Ulta. At first glance, these fears seem justified. Ulta has been growing revenue 20-25% a year for several years now and recently passed Sally Beauty in terms of total sales. Sephora doesn’t disclose its results individually, but, according to its parent company LVMH, it continues to gain market share.
It would be easy to look at these results and say that Ulta and Sephora are squeezing Sally Beauty out, except that Sally Beauty continues to grow same store sales in the low single digits year after year. Plus, those other chains carry products that are most directly comparable to the offerings of the BSG segment, which is growing same store sales even faster, at 7% last quarter.
Ulta and Sephora aren’t taking share from Sally Beauty, they’re squeezing out drugstores like Walgreens (WAG) and CVS (CVS) along with big department stores. What’s more, Sally Beauty has an opportunity to grab some of this share for itself through a store refresh program that will adopt some of the design features—hardwood floors, LED lighting, and interactive displays—that have driven customers to Sephora and Ulta.
The company has already refreshed 1,000 Sally Beauty stores and plans to refresh another 500 per year going forward. Again, we see the compelling store economics materialize. These store refreshes cost just $20,000 each, so 500 a year is a capital investment of just $10 million, easily covered by the company’s free cash flow.
So far, Sally Beauty reports a 100 to 150 basis point increase in comparable sales for stores that have been refreshed versus those that haven’t.
In our last long idea on Skechers (SKX), we talked about the “fast follower” advantage. Ulta and Sephora pioneered a new look and style for cosmetics shopping that has disrupted the traditional drug and department store model. Now, Sally Beauty has the opportunity to take those same innovations and leverage them with its scale, distribution, and exclusive merchandise.
Far from threatening Sally Beauty’s existence, Ulta and Sephora have laid a roadmap for it to start taking away even more customers from mass-market competitors. The fact that 80% of Sally Beauty’s merchandise is not found in mass-market stores and 47% of its retail sales come from exclusive-label products should help the company expand its market share.
Very Attractive Valuation
Concerns over competition and slow growth seem to have kept Sally Beauty’s valuation depressed below its true profit potential. Even after a 13% gain so far in 2016, the stock still has a price to economic book value (PEBV) of just 1.1 at its current price of $32/share. This ratio implies that the company will grow after tax operating profit (NOPAT) by no more than 10% for the remainder of its corporate life. Those are pretty low expectations for a company that has grown NOPAT by 12% compounded annually since it spun off into a single entity in 2006.
Even with modest growth, Sally Beauty has significant upside. If the company can grow NOPAT by 3% compounded annually for the next 10 years, the stock has a fair value of $43/share today, 36% above the current price.
It seems that the market has failed to recognize Sally Beauty’s exceptional earnings quality and overrated the threat of competition. In addition, we believe the market has underrated the effect of one recent change that should be a significant driver of long-term shareholder value.
Executive Compensation Plan Rewards Value Creation
We’ve written a great deal recently about the dangers of misaligned incentives in executive compensation plans. Compensation plans that only reward executives for boosting metrics such as sales growth and “adjusted” EPS can lead to value destroying behavior such as overpaying for acquisitions.
That’s why we were so excited when we dug into Sally Beauty’s proxy statement to find that it updated its compensation program this year to reward executives for maximizing ROIC. 33% of share-based compensation for executives in 2016 will come in the form of performance-based restricted stock units that only vest if the company hits targets for both sales growth and ROIC over the next three years. The more growth and higher returns, the more of their restricted stock vests.
Figure 2: ROIC Vs. Valuation For The S&P 500
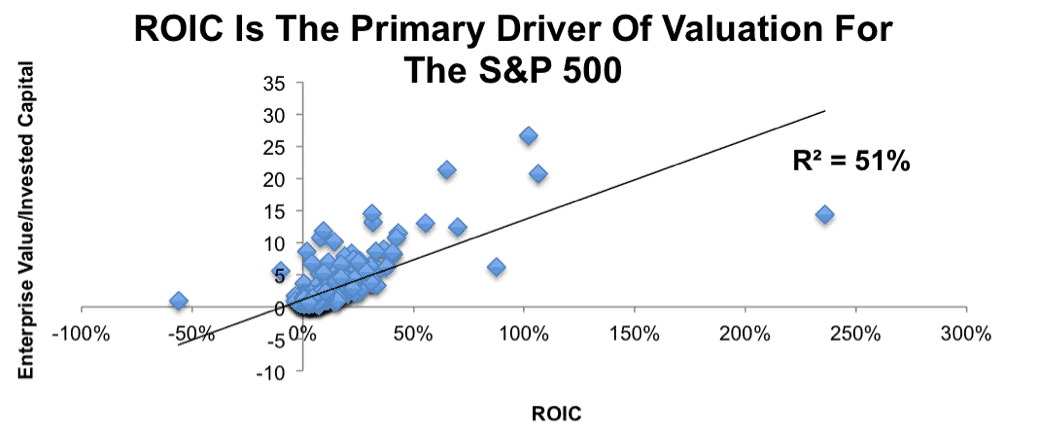
Sources: New Constructs, LLC and company filings
As Figure 2 shows, ROIC explains over 50% of the difference in valuation between companies in the S&P 500. Increasing ROIC is the best way to create long-term value for shareholders. Tying executive compensation to ROIC is the best way to align their incentives with those of the company’s investors.
In addition, we like the fact that 20% of their annual cash bonuses are tied to the ratio of working capital to revenue. The less working capital the company holds as a percent of revenue, the higher their bonuses. It’s nice to see the compensation committee look past the income statement and reward efficient use of assets on the balance sheet.
The compensation plan is not perfect. 50% of annual cash bonuses are tied to Adjusted EBITDA, a non-GAAP metric that, among other things, excludes share-based compensation. However, this plan is quite a bit better than most of the executive compensation schemes out there. The long-term focus on ROIC should serve investors well, as evidenced by the outperformance of other companies that have tied compensation to ROIC such as AutoZone (AZO) and Target (TGT).
Opportunities For Improvement
Hopefully the emphasis on ROIC will encourage executives to focus their efforts on a couple areas where the company has disappointed in recent years. As Figure 3 shows, inventory management and cost control have both been poor in the past few years after improving between 2007-2011.
Figure 3: Days In Inventory And SG&A On The Rise
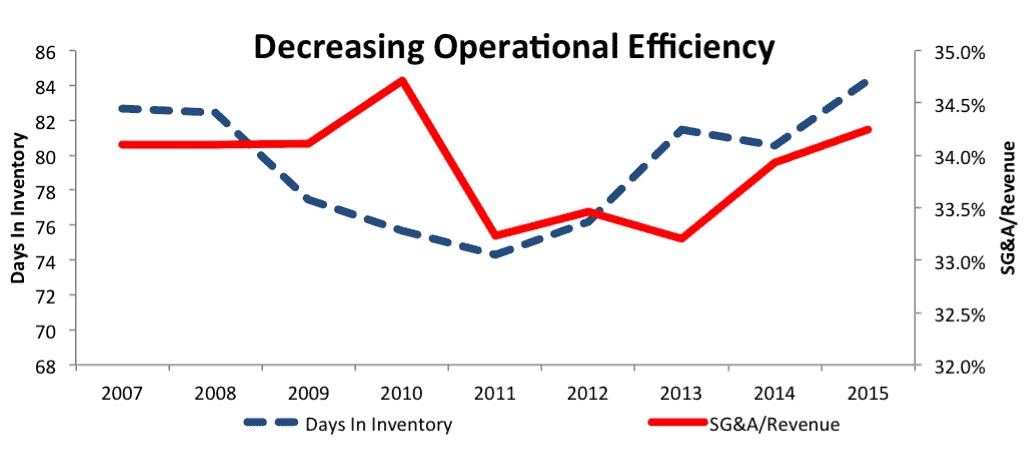
Sources: New Constructs, LLC and company filings
Management could boost ROIC by cutting excessive spending on SG&A. For 2015, Sally Beauty spent 34.2% of revenue on SG&A, 30 basis points above its long-term average and 100 basis points above its level in 2013.
The company says it’s focused over the next year on the store refresh initiative and marketing the refreshed stores to consumers, so it expects SG&A to stay at the same proportion. However, reducing its elevated level of SG&A creates an opportunity for margin expansion and improved return on capital.
In addition, decreasing days in inventory would increase ROIC by both decreasing the amount of overall invested capital and reducing the costs associated with storing inventory. Sally Beauty’s superior performance on both of these metrics just a few years ago show that the company has opportunity and capability to improve on this front.
The company has done a good job improving its gross margins in recent years, which has masked this decrease in operational efficiency. We believe that the new compensation plan will better incentivize executives to focus on improving these under looked metrics that can have a big impact on shareholder value.
Share Buybacks Provide Nice Yield
Sally Beauty spent $228 million (5% of market cap) on buybacks in 2015. Though down from $333 million in 2014 and $510 million in 2013, this level of buyback offers a nice yield (5%) to further cushion downside risk.
Insider Trading Raises No Red Flags
Over the past twelve months, insiders have sold 393 thousand shares. Taking into account the options and grants they’ve received, insiders have reduced their total shares held by just 1% over the past twelve months. Insider trades are not showing a clear signal in either direction for the stock.
Impact of Footnotes Adjustments and Forensic Accounting
We have made several adjustments to Sally Beauty’s 2015 10-K. The adjustments are
- Income Statement: Including the $13.5 million in non-operating expenses hidden in operating earnings we discussed above, we made $216 million worth of adjustments to net income with a net impact of removing $101 million (3% of revenue) in non-operating expenses. Our largest adjustment was the removal of $117 million in interest payments.
- Balance Sheet: We made $675 million in balance sheet adjustments to calculate invested capital. Our biggest adjustment was adding back $552 million in off-balance sheet debt.
- Valuation Adjustments: We subtracted $2.4 billion from shareholder value, due to total debt, employee stock option liabilities, and deferred tax liabilities.
Bottom Line
Through a combination of hidden non-operating expenses, overstated fears of competition, and an under appreciation of the impact of its new compensation plan, the market has significantly undervalued Sally Beauty Holdings. The stock’s valuation embeds low expectations for profit growth despite a long-term track record of increasing cash flows.
This late into a bull market, it’s hard to find companies operating in recession-proof industries that have such attractive fundamentals and valuations. Investors should add Sally Beauty to their portfolios to decrease risk while still getting significant potential upside.
Attractive Funds That Hold SBH
The following fund receives our Attractive-or-better rating and allocates significantly to Sally Beauty.
- Eaton Vance Atlanta Capital SMID-Cap Fund (EISMX, ERSMX, ERASX): 3.4% allocation and Attractive rating.
This article originally published here on May 4, 2016.
Disclosure: David Trainer, Allen Jackson, and Sam McBride receive no compensation to write about any specific stock, sector, style, or theme.