Editor’s Note: Since we published this report, HollyFrontier changed its name and ticker to HF Sinclair Corporation (DINO).
We published an update on UHS on March 2, 2022. A copy of the associated Earnings Update report is here.
We published an update on HFC on March 2, 2022. A copy of the associated Earnings Update report is here.
We published an update on ALSN on February 23, 2022. A copy of the associated Earnings Update report is here.
After affirming our long thesis on three of our “See Through the Dip” stocks last week, we’re reiterating six more Long Ideas post recent earnings reports.
Target Corporation (TGT:$173/share), Universal Health Services, Inc. (UHS: $129/share), MasTec Inc. (MTZ: $89/share), HollyFrontier Corp (HFC: $37/share), Standard Motor Products (SMP: $43/share), and Allison Transmission Inc. (ALSN: $39/share) are this week’s Long Ideas.
These Long Ideas Still Have Room to Run
We leverage more reliable fundamental data, proven in The Journal of Financial Economics[1], with qualitative research to highlight firms whose stocks present excellent risk/reward. Figure 1 shows the performance of the six Long Ideas featured in this report.
Figure 1: Long Idea Performance: From Date of Publication Through 3/2/2021
Sources: New Constructs, LLC
*Measured from the date of publication of each respective original report. Dates can be seen in each company section below.
Target Is Great Long-Term Value
We made Target a Long Idea in April 2015 and reiterated it in June 2019. Here’s what we learned from the 4Q20 earnings report and why we still like this stock.
What’s Working: For years, bears believed Target’s brick-and-mortar presence would hinder its ability to gain market share. However, Target leverages its physical stores as the centerpiece of its omni-channel distribution strategy, and it is working. Target grew revenue by 19% year-over-year (YoY) in 2020, which was driven by a strong e-commerce business that adapted to customers’ new shopping habits during COVID-19.
Target’s digital sales grew 145% year-over-year (YoY) in 2020 and now account for 18% of its total revenue. Target’s share of the U.S. retail market grew from 1.4% in 2019 to 1.9% in 2020.
Target’s physical store presence also allows it to partner with major brands and to build stores-within-stores to enhance customers’ experience with popular brands. Target’s partners, which include Apple (AAPL), Disney (DIS), Ulta Beauty (ULTA) and Levi Strauss (LEVI), invest in marketing their offerings within Target to create a better shopping experience than Target employees can provide on their own. These partnerships not only enhance Target’s customers’ experience, they also broaden its offerings.
What’s Not Working: Despite impressive revenue growth, Target still lost ground to Amazon (AMZN), which saw its revenue jump by 38% in 2020.
Furthermore, judging by the market reaction, investors aren’t enthused about Target’s plans to invest $4 billion (vs. $2.7 billion in 2020) annually over the next few years to continue to fuel its brick-and-mortar and e-commerce efforts. Shares fell by 7% on the day of the announcement.
However, we believe Target’s increased investment in its business is good news for investors over the long term, especially given Target’s track record of creating shareholder value. Target’s executive compensation is linked to return on invested capital (ROIC), the key driver of shareholder value creation. By incentivizing executives to improve ROIC, managements’ interests are aligned with investors’ interests. The firm’s focus on ROIC has led to ROIC rising from 7% in 2014 to 14% over the trailing-twelve-months (TTM) while its economic earnings grew from $1.3 billion to $3.6 billion over the same time.
Current Price Leaves Lots of Upside: Below we use our reverse discounted cash flow (DCF) model to analyze the implied value of the stock based on conservative assumptions about Target’s future growth in cash flows.
In this scenario, we assume:
- Target maintains its TTM NOPAT margin of 5.5% in 2020. NOPAT margin falls to 4.7% (five-year average vs. 5.5% TTM) in 2021 and each year thereafter and
- revenue grows by 0.5% compounded annually from 2021-2022 (in line with consensus revenue growth estimates) and
- revenue grows by 3.5% compounded annually thereafter, which equals the average annual global GDP growth rate since 1961.
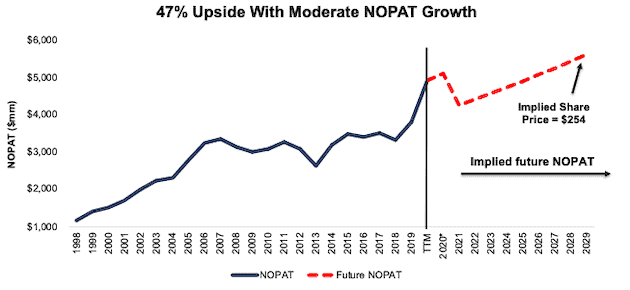
In this scenario, Target’s net operating profit after-tax (NOPAT) grows by just 4% compounded annually over the next decade and the stock is worth $254/share today – a 47% upside to the current price. See the math behind this reverse DCF scenario. For reference, Target grew NOPAT by 6% compounded annually from 2014 to 2019.
Figure 2: Target’s Historical and Implied NOPAT
Sources: New Constructs, LLC and company filings
Universal Health Services Still Looks Cheap
Universal Health Services is one of our “See Through the Dip” stocks from July 2020. Here’s what we learned from 4Q20 earnings and why the stock still provides quality risk/reward.
What’s Working: While the COVID-19 pandemic led to declines in higher-margin elective surgeries, Universal Health Services grew revenue by 2% YoY and improved its ROIC from 9.9% in 2019 to 10.2% in 2020.
Even in a difficult operating environment, the firm grew its Acute Care segment revenue from $6.2 billion in 2019 to $6.3 billion in 2020. Acute Care accounts for 55% of the firm’s 2020 revenue, up from 54% in 2019.The firm leverages its expertise in behavioral care to partner with existing acute care facilities to open new behavioral health facilities. Universal Health Services is growing its joint venture portfolio and recently announced two more partnerships with Southeast Health and MercyOne.
What’s Not Working: The firm’s Behavioral Care segment underperformed and revenue in 2020 was flat YoY. The total number of patient days in the firm’s Behavioral Care centers declined by 5% YoY in 2020 while the occupancy rate of Behavioral Care licensed beds fell from 75% to 71% over the same time.
While the firm’s occupancy rates in Acute Care beds remained unchanged in 2020, the pandemic led to a decline in admissions across both the Acute Care and Behavioral Health segments. Despite the challenges in 2020, we believe the long-term tailwinds in both acute care (aging population) and behavioral health (increased awareness of mental health) create lasting revenue growth opportunities. More details in our original report here.
Current Price Leaves Upside: We use our reverse DCF model to analyze the implied value of the stock based on conservative assumptions about Universal Health Services’ future growth in cash flows.
In this scenario, we assume:
- Universal Health Services maintains its 2020 NOPAT margin of 9.1% and
- revenue grows at 3.6% compounded annually from 2021-2022 (equal to consensus estimates) and
- revenue grows at 3% each year thereafter, which is below the average annual global GDP growth rate since 1961 and below the behavioral health market CAGR of 5% through 2027.
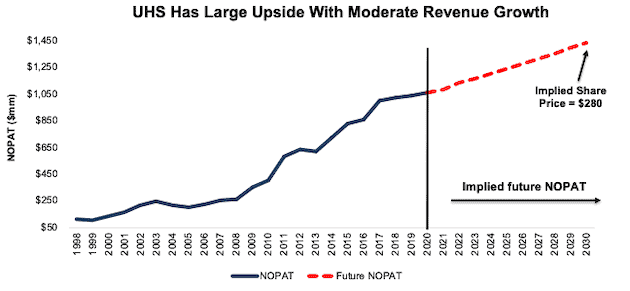
In this scenario, Universal Health Services’ NOPAT grows by 3% compounded annually over the next decade and the stock is worth $280/share today – a 117% upside to the current price. See the math behind this reverse DCF scenario. For reference, Universal Health Services has grown its NOPAT by 5% compounded annually over the past five years and 10% compounded annually over the past 10 years.
Figure 3: Universal Health Services’ Historical and Implied NOPAT
Sources: New Constructs, LLC and company filings
MasTec Is Positioned for Long-Term Growth
MasTec is one of our “See Through the Dip” stocks from June 2020. Here’s what we learned from 4Q20 earnings and why MTZ remains an open Long Idea.
What’s Working: MasTec expects 2021 to be much improved over 2020. The firm guided for revenue growth of 24% YoY and expects multiple long-term tailwinds across its business segments to drive growth. The firm’s Communications segment should benefit from accelerated data consumption (spurred along by the adoption of 5G). Grand View Research expects the global 5G infrastructure market to grow by 60% compounded annually from 2020 to 2027.
The firm’s Clean Energy segment could also add benefit as businesses and governments worldwide focus on using power from renewable sources such as wind, solar, and biomass.
Additionally, industry trends favoring more natural gas-fired electrical generation should persist. The U.S. Energy Information Administration (EIA) projects natural gas exports to rise through 2030, which should also compliment the firm’s pipeline construction segment.
What’s Not Working: Overall, the challenging economic environment hindered the firm’s ability to grow its backlog. MasTec’s estimated 18-month backlog fell from $8 billion in 2019 to $7.9 billion in at the end of 2020.
Additionally, just weeks after being awarded a contract to construct a portion of the Keystone XL pipeline, the Keystone XL pipeline’s permit was revoked. Increased regulatory intervention and the reduction in demand for fossil fuel energy products due to the pandemic is affecting demand for pipeline construction. If this trend continues, the firm’s strong backlog in pipeline projects could deteriorate. However, oil and gas projects make up just 32% of the firm’s backlog, with the majority coming from Communications and Clean Energy and Infrastructure projects.
MasTec also experienced delays to two projects in its Electrical Transmission business partly due to the pandemic. However, one of the delayed projects has now begun and the other is expected to begin later in 2021.
Current Price Still Leaves Upside: Despite significantly outperforming the market since our original article, MTZ remains undervalued. Below we use our reverse DCF model to analyze the implied value of the stock based on conservative assumptions about MasTec’s future growth in cash flows.
In this scenario, we assume:
- MasTec maintains its 2020 NOPAT margin of 5.6% (vs. 6.4% in 2019) and
- revenue grows by 9% compounded annually from 2021 to 2025 (equal to consensus estimates) and
- revenue grows by 3% each year thereafter, which is below the average annual global GDP growth rate since 1961.
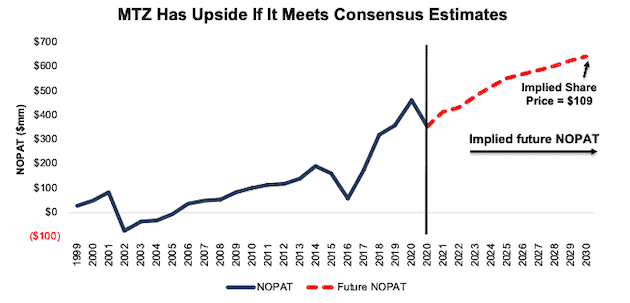
In this scenario, MasTec’s NOPAT grows by 6% compounded annually over the next 10 years and the stock is worth $109/share today – a 22% upside to the current price. See the math behind this reverse DCF scenario. For reference, MasTec grew NOPAT by 12% compounded annually over the past decade and 8% compounded annually over the past two decades.
Figure 4: MasTec’s Historical and Implied NOPAT
Sources: New Constructs, LLC and company filings
HollyFrontier Provides Quality Risk/Reward
HollyFrontier is one of our See Through the Dip stocks from July 2020. Here’s what we learned from the 4Q20 earnings report and why we still like this stock.
What’s Working: Despite the challenging operating environment, HollyFrontier generated $607 million of free cash flow (FCF) in 2020. Since 2018, the firm has generated $2 billion (32% of market cap) in FCF.
The firm is also the majority owner of Holly Energy Partners, L.P., a.ka. “HEP”, which owns and operates transportation and storage assets. While HollyFrontier’s refining, lubricants and specialty products revenue fell 36% YoY in 2020, HEP’s revenue fell by only 7% over the same time and was supported by long-term minimum volume commitments.
Though HollyFrontier is positioned as a middleman that can take advantage of price spreads in high- and low-priced oil environments, the stock is often affected by movements in the price of oil. Recent Saudi oil production cuts could signal the worst is over for the Energy industry, which means investor money could begin to rotate back to the Energy market.
What’s Not Working: Extended lockdowns have delayed the return of business and leisure travel and hurt demand for refined petroleum products. Additionally, long-term shifts to WFH could affect future growth in refined petroleum products. In recognition of a changing market, HollyFrontier permanently ceased refining operations at its Cheyenne refinery and the firm’s total crude oil processing capacity of 405 thousand barrels per stream day (BPSD) ended 2020 11% lower than 2019.
While costly in the short-term, HollyFrontier will convert its Cheyenne refinery to produce renewable diesel, its second renewable diesel facility. This conversion will help turn the plant from obsolete to a driver of growth and better position HollyFrontier to meet the rising demand for renewable diesel, a market that is expected to grow by 16% compounded annually from 2020 to 2024.
Current Price Leaves Lots of Upside: Below we use our reverse DCF model to analyze the implied value of the stock based on conservative assumptions about HollyFrontier’s future growth in cash flows.
In this scenario, we assume:
- HollyFrontier’s NOPAT margin improves to 6% (average from 2015-2019 vs. -0.3% 2020) and
- revenue grows by 8% compounded annually from 2021-2022 (in line with consensus estimates) and
- revenue grows by 3% compounded annually each year thereafter, which is below the average global GDP growth rate of 3.5% since 1961.
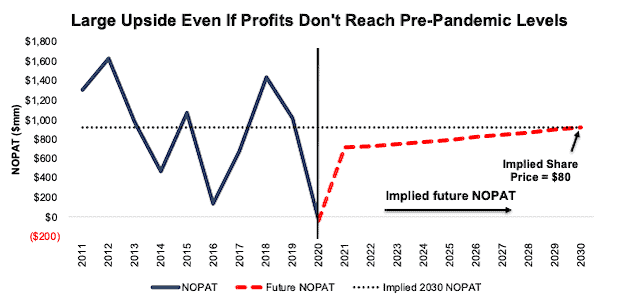
In this scenario, HollyFrontier’s revenue grows by just 5% compounded annually over the next decade and the stock is worth $80/share today – a 116% upside to the current price. See the math behind this reverse DCF scenario. In this scenario, HollyFrontier’s NOPAT is 9% below 2019 levels. During the nine-year period from 2011 to 2019, HollyFrontier’s NOPAT was lower than its implied 2030 level just three times.
Figure 5: HollyFrontier’s Historical and Implied NOPAT
Sources: New Constructs, LLC and company filings
Standard Motor Products Provides Value Despite Customer Loss
We made Standard Motor Products a Long Idea in May 2017 and included it in our See Through the Dip thesis in June 2020. Here’s what we learned from the 4Q20 earnings report and why we still like this stock.
What’s Working: Standard Motor Products’ reported record 4Q20 revenues, which were up 17% YoY. While revenue declined 15% YoY in the first half of 2020, a strong second half of the year led to a less than 1% decline in YoY revenue in 2020.
The long-term tailwind of aging vehicles continues to drive demand for this auto parts manufacturer as new-vehicle sales slumped during the pandemic. The average age of vehicles on the road is now nearly 12 years and 25% of cars in the U.S. are at least sixteen years old. Older vehicles mean more repairs, which should continue to translate into more sales for Standard Motor Products over the long run.
What’s Not Working: Standard Motor Products lost one of the five customers that accounted for 68% of its total revenue in 2020. That customer, which brought ~$140 million (12% of 2020 revenue) in annual revenue, decided to source its engine management products from other suppliers and sell them under its own private label.
While this customer loss hurts, Standard Motor Products remains a valuable provider within the after-market auto parts industry. The firm is a full-line, full-service provider with over 40,000 engine management parts. It also has manufacturing and distribution facilities in the U.S., Canada, Mexico, Poland, and China which reduces sourcing issues for retailers.
The firm’s relationship with its remaining customers also appears to be strong. O’Reilly Auto Parts named Standard Motor Parts as its supplier of the year in 2020, and Standard Motor Products already manufactures NAPA’s own private label products.
Current Price Leaves Upside Potential: Below we use our reverse DCF model to analyze the implied value of the stock based on conservative assumptions about Standard Motor Products’ future growth in cash flows.
In this scenario, we assume:
- Standard Motor Products’ NOPAT margin falls to 7% (five-year average vs. 8% TTM) and
- revenue falls by 1% compounded annually over the next decade, which includes a 12% drop in 2021 (representing a decline of $140 million from lost customer) 0.5% growth each year thereafter.
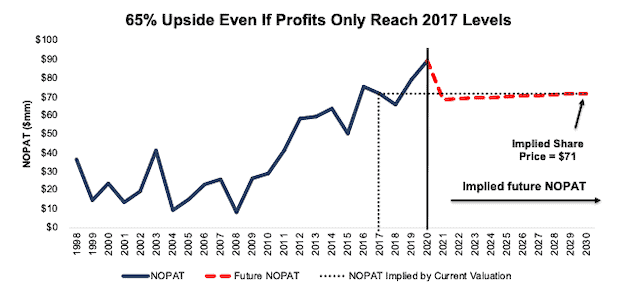
In this scenario, Standard Motor Products’ NOPAT falls by 2% compounded annually over the next decade and the stock is worth $71/share today – a 65% upside to the current price. See the math behind this reverse DCF scenario. In this scenario, Standard Motor Products’ NOPAT in 2030 is 20% below its 2020 NOPAT and equal to its 2017 NOPAT.
Figure 6: Standard Motor Products’ Historical and Implied NOPAT
Sources: New Constructs, LLC and company filings
Allison Transmission Still Generates Lots of Cash
Allison Transmission is one of our See Through the Dip stocks from June 2020. Here’s what we learned from the 4Q20 earnings report and why we still like this stock.
What’s Working: In 2020, the pandemic caused considerable volatility in demand and labor, as well as supply constraints, which drove Allison Transmission’s revenue down 23% YoY in 2020. However, signs of a recovery appeared in the second half of 2020 as Allison Transmission’s revenue grew quarter-over-quarter in both 3Q20 and 4Q20.
The firm improved its market share in the on-highway Class 8 Straight market from 74% in 2019 to 80% in 2020. The firm also improved its share in the motorhome segment from 41% in 2019 to 47% in 2020. Overall, the firm has nearly 60% global market share of fully automatic transmissions for medium- and heavy-duty commercial vehicles.
Despite the difficult operating environment, the firm generated generated $437 million in FCF. Over the past five years, the firm has generated $2.6 billion (58% of market cap) in FCF.
The firm’s ability to generate cash allows it to stay committed to its R&D initiatives involving electrified propulsion systems as the firm positions itself for long-term growth within the EV market. Allison Transmission’s expects its new innovation center will open in 2021, which will further enhance its R&D developments.
What’s Not Working: Allison Transmission faced lower operating volume, an inability to obtain parts from suppliers, decreased customer demand, and temporary suspension of operations in some locations throughout 2020. The difficult operating climate drove Allison Transmission’s ROIC lower from 17% in 2019 to 10% in 2020, which led to the firm’s first YoY decline in economic earnings since 2016.
The firm also lost market share in Class 4-5 trucks, which fell from 16% in 2019 to 14% in 2020 and Class 6-7 trucks, which fell from 76% to 75% over the same time.
Current Price Remains Cheap: Despite the tough 2020, ALSN still provides significant upside potential. Below we use our reverse DCF model to analyze the implied value of the stock based on conservative assumptions about Allison Transmission’s future growth in cash flows.
In this scenario, we assume:
- Allison Transmission’s NOPAT margin falls to 19.1% (average since 2012 vs. 19.6% TTM) and
- revenue grows by 1% compounded annually for the next 10 years, which is below consensus revenue growth estimates of 8% compounded annually from 2021 to 2023.
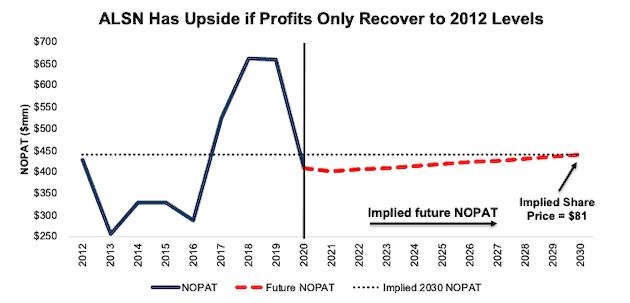
In this scenario, Allison Transmission’s NOPAT grows by just 1% compounded annually over the next decade and the stock is worth $81/share today – a 108% upside to the current price. See the math behind this reverse DCF scenario. In this scenario, Allison Transmission’s NOPAT in 2030 is 34% below its 2019 NOPAT and just 3% above its 2012 NOPAT.
Figure 7: Allison Transmission’s Historical and Implied NOPAT
Sources: New Constructs, LLC and company filings
The Real Earnings Season Is Now Here
While the traditional quarterly earnings season may be winding down, the real earnings season – 10-K filing season – is just getting started. Traditional, unscrubbed earnings for U.S. stocks are off by an average of ~20%. Investors deserve more reliable fundamental research based on rigorous analysis of the footnotes and MD&A. Our Core Earnings give investors a more reliable measure of a firm’s profitability and valuation by removing all the unusual items that distort unscrubbed data from other providers. Our proprietary, adjusted fundamental data supports our research into Long Ideas like Target, Universal Health Services, MasTec, HollyFrontier, Standard Motor Products, and Allison Transmission.
This article originally published on March 3, 2021.
Disclosure: Matt Shuler owns HFC. David Trainer, Kyle Guske II, and Matt Shuler receive no compensation to write about any specific stock, sector, style, or theme.
Follow us on Twitter, Facebook, LinkedIn, and StockTwits for real-time alerts on all our research.
[1] Our reports utilize our Core Earnings, a more reliable measure of profits, as demonstrated in Core Earnings: New Data & Evidence, a paper by professors at Harvard Business School (HBS) & MIT Sloan. Recently accepted by the Journal of Financial Economics, the paper proves that our data is superior to all the metrics offered elsewhere.


