Recap from March Picks
Our Most Attractive Stocks (+1.1%) underperformed the S&P 500 (+3.3%) last month. Most Attractive Large Cap stock Robert Half International (RHI) gained 10% and Most Attractive Small Cap stock Liberty Tax (TAX) was up 19%. Overall, 14 out of the 40 Most Attractive stocks outperformed the S&P 500 in March and 24 out of 40 had positive returns.
Our Most Dangerous Stocks (+3.3%) rose slightly less than the S&P 500 (+3.3%) last month and outperformed as a short portfolio. Most Dangerous Large Cap stock PulteGroup (PHM) fell by 4% and Most Dangerous Small Cap Stock Xura, Inc. (MESG) fell by 8%. Overall, 15 out of the 40 Most Dangerous stocks outperformed the S&P 500 in March.
The successes of the Most Attractive and Most Dangerous stocks highlight the value of our forensic accounting. Being a true value investor is an increasingly difficult, if not impossible, task considering the amount of data contained in the ever-longer annual reports. By analyzing key details in these SEC filings, our research protects investors’ portfolios and allows our clients to execute value-investing strategies with more confidence and integrity.
21 new stocks make our Most Attractive list this month and 20 new stocks fall onto the Most Dangerous list this month. April’s Most Attractive and Most Dangerous stocks were made available to members on April 6, 2016.
Our Most Attractive stocks have high and rising return on invested capital (ROIC) and low price to economic book value ratios. Most Dangerous stocks have misleading earnings and long growth appreciation periods implied by their market valuations.
Most Attractive Stock Feature for April: Credit Acceptance Corp (CACC: $184/share)
Credit Acceptance Corp (CACC), automotive financing provider, is one of the additions to our Most Attractive stocks for April.
Credit Acceptance Corp hasn’t only been the beneficiary of the recent surge in automobile sales, but also has been building a solid business for more than a decade. Since 2005, Credit Acceptance Corp has grown after-tax profit (NOPAT) by 19% compounded annually.
Figure 1: Credit Acceptance’s Historical Profit Growth
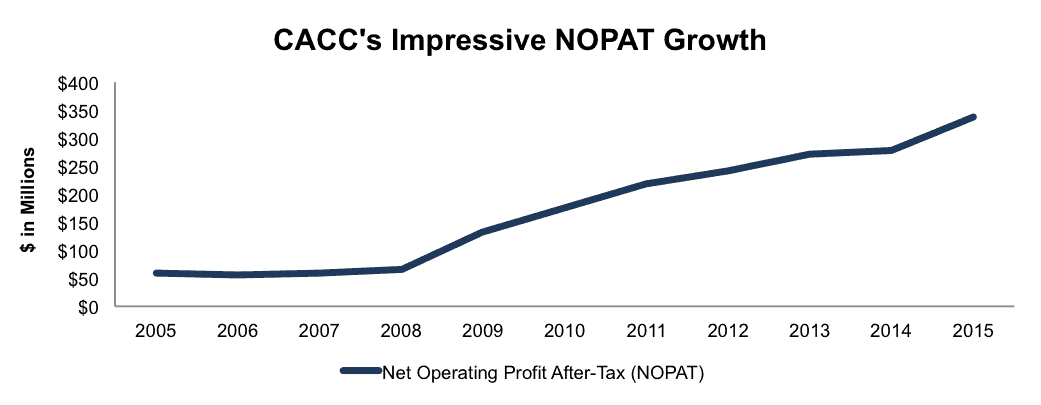
Sources: New Constructs, LLC and company filings
CACC’s return on invested capital (ROIC) has also been rising from 11% in 2005 to 26% over the last twelve months. The company’s NOPAT margin has increased from 29% to 41% over this same time frame. Across all facets of business, CACC has seen marked improvement.
Impacts of Footnotes Adjustments and Forensic Accounting
In order to derive the true recurring cash flows, an accurate invested capital, and a real shareholder value, we made the following adjustments to Credit Acceptance’s 2015 10-K:
Income Statement: we made $37 million (4% of revenue) of adjustments, all of which were to remove non-operating expenses included in operating earnings. The largest adjustment was the removal of nearly $37 million due to changes in reserves. You can see all the adjustments made to CACC’s income statement here.
Balance Sheet: we made $415 million of adjustments to calculate invested capital with a net increase of $117 million. The largest adjustment was the inclusion of $244 million related to reserves. We add reserves back to invested capital for the calculation of ROIC. This adjustment represented 21% of reported net assets. You can see all the adjustments made to CACC’s balance sheet here.
Valuation: we made $253 million of adjustments with a net effect of decreasing shareholder value by $253 million. There were no adjustments that increased shareholder value. The largest adjustment was the removal of $249 million due to the net deferred tax liabilities. This adjustment represents 7% of Credit Acceptance Corp’s market cap. Despite the decrease in shareholder value, CACC remains undervalued.
Credit Acceptance Corp’s Share Price Remains Undervalued
CACC is down 13% year-to-date, despite the strength of the underlying business. This price decline has left shares undervalued. At its current price of $184/share, CACC has a price-to-economic book value (PEBV) ratio of 0.8. This ratio means that the market expects CACC’s NOPAT to permanently decline by 20%. This expectation is at odds with the track record of the company. If CACC can grow NOPAT by just 8% compounded annually for the next five years, the stock is worth $317/share today – a 72% upside
Most Dangerous Stock Feature: Qiagen NV (QGEN: $23/share)
Qiagen (QGEN), medical research service provider, is one of the additions to our Most Dangerous stocks for April.
Despite a track record of revenue growth, Qiagen’s business model has been unable to convert revenue into meaningful profits. Since 2005, QGEN’s revenue has grown by 12% compounded annually while the company’s economic earnings have declined from $15 million to -$121 million. Figure 2 has details.
Figure 2: Economic Earnings Reveal Lack of Profits
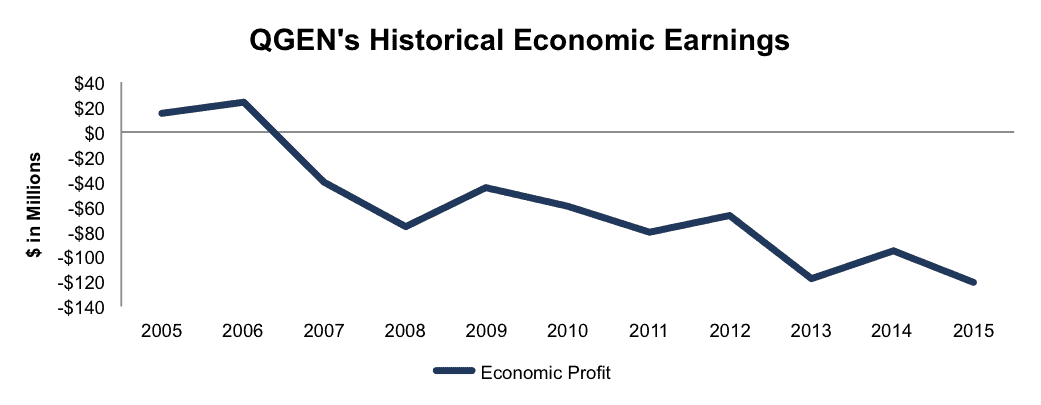
Sources: New Constructs, LLC and company filings
The company’s ROIC has fallen from 12% in 2005 to a bottom-quintile 4% over the last twelve months.
Impacts of Footnotes Adjustments and Forensic Accounting
In order to derive the true recurring cash flows, an accurate invested capital, and a real shareholder value, we made the following adjustments to Qiagen’s 2015 10-K:
Income Statement: we made $67 million of adjustments with a net impact of removing $47 million in non-operating expenses. We removed $57 million in non-operating expenses and $10 million in non-operating income. You can see all the adjustments made to QGEN’s income statement here.
Balance Sheet: we made $982 million of adjustments to calculate invested capital with a net increase of $94 million. The largest adjustment was $262 million related to other comprehensive income. This adjustment represented 7% of reported net assets. You can see all the adjustments made to QGEN’s balance sheet here.
Valuation: we made $1.5 billion of adjustments with a net effect of decreasing shareholder value by $793 million. The largest adjustment was the removal of $1.1 billion in debt, which includes $48 million in off-balance sheet operating leases. This adjustment represents 21% of Qiagen’s market cap.
QGEN Shares Remain Overvalued
QGEN may be down 10% over the past year, but shares are still expensive. The current expectations embedded into the stock price imply significant profit growth. To justify its current price of $23/share, QGEN must grow NOPAT by 14% compounded annually for the next 12 years. Keep in mind that since 2009, QGEN has only grown NOPAT by just over 1% compounded annually.
If QGEN can grow NOPAT by 6% compounded annually for the next decade, the stock is worth $11/share today – a 52% downside.
Disclosure: David Trainer and Kyle Guske II receive no compensation to write about any specific stock, style, or theme.