Recap from April Picks
Our Most Attractive Stocks (+1.7%) outperformed the S&P 500 (+0.7%) last month. Most Attractive Large Cap stock Skechers U.S.A. (SKX) (Long Idea of the week) gained 19% and Most Attractive Small Cap stock Lee Enterprises (LEE) was up 30%. 21 out of the 40 Most Attractive stocks outperformed the S&P 500 in April.
Our Most Dangerous Stocks (+2.3%) underperformed the S&P 500 (+0.7%) last month. Most Dangerous Large Cap stock Community Health Systems (CYH) fell by 16% and Most Dangerous Small Cap Stock TrueBlue (TBI) fell by 26%. Overall, 14 out of the 40 Most Dangerous stocks outperformed the S&P 500 in April.
The successes of the Most Attractive and Most Dangerous stocks highlight the value of our forensic accounting. Being a true value investor is an increasingly difficult, if not impossible, task considering the amount of data contained in the ever-longer annual reports. By analyzing key details in these SEC filings, our research protects investors’ and allows our clients to execute value-investing strategies with more confidence and integrity.
18 new stocks make our Most Attractive list this month and 13 new stocks fall onto the Most Dangerous list this month. May’s Most Attractive and Most Dangerous stocks were made available to members on May 4, 2016.
Our Most Attractive stocks have high and rising return on invested capital (ROIC) and low price to economic book value ratios. Most Dangerous stocks have misleading earnings and long growth appreciation periods implied by their market valuations.
Most Attractive Stock Feature for May: Hawaiian Holdings (HA: $42/share)
Hawaiian Holdings (HA), regional air transportation provider, is one of the additions to our Most Attractive stocks for May.
Hawaiian Holdings has built a highly profitable business servicing airline routes to, from, and between Hawaii. Over the past decade, HA has grown after-tax profit (NOPAT) by 27% compounded annually. Figure 1 has more details.
Figure 1: Hawaiian Holdings Long-Term NOPAT
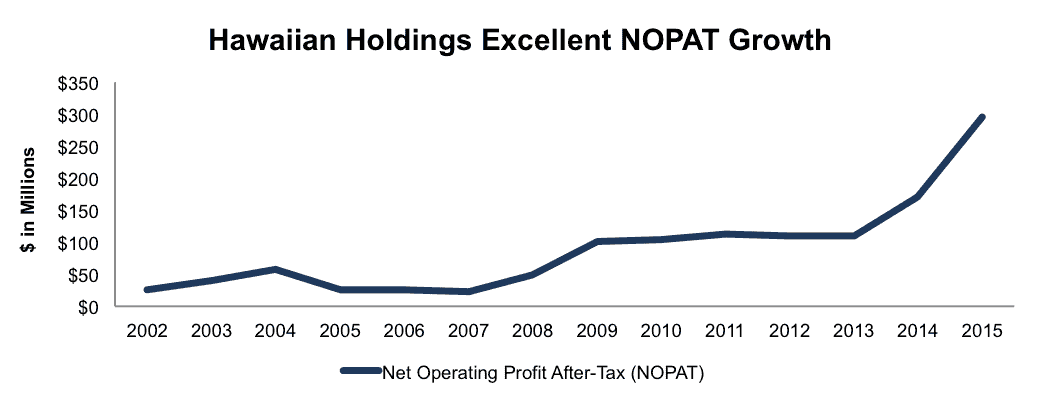
Sources: New Constructs, LLC and company filings
HA’s return on invested capital (ROIC) has improved from 2% in 2005 to 14% over the last twelve months. Over the same time, the company’s NOPAT margin has increased from 5% to 13%.
Impacts of Footnotes Adjustments and Forensic Accounting
In order to derive the true recurring cash flows, an accurate invested capital, and a real shareholder value, we made the following adjustments to Hawaiian Holdings’ 2015 10-K:
Income Statement: we made $313 million (14% of revenue) of adjustments, with a net effect of removing $114 million in non-operating expenses. We removed $99 million in non-operating income and $214 million in non-operating expenses. You can see all the adjustments made to HA’s income statement here.
Balance Sheet: we made $1.3 billion of adjustments to calculate invested capital with a net increase of $441 million. One of the largest adjustments was the removal of $444 million in excess cash. This adjustment represented 26% of reported net assets. You can see all the adjustments made to HA’s balance sheet here.
Valuation: we made $2.4 billion of adjustments with a net effect of decreasing shareholder value by $1.3 billion. The largest adjustment was the removal of $677 million due to off balance sheet operating leases. This adjustment represents 30% of Hawaiian Holdings’ market cap. Despite the decrease in shareholder value, HA remains undervalued.
HA Remains Undervalued
Hawaiian Holdings, despite the strength of its business, is significantly undervalued. At its current price of $42/share, Hawaiian Holdings has a price-to-economic book value (PEBV) ratio of 0.8. This ratio means that the market expects Hawaiian Holding’s NOPAT to permanently decline by 20%. If Hawaiian can grow NOPAT by just 7% compounded annually for the next decade, the stock is worth $80/share today – a 90% upside.
Most Dangerous Stock Feature: Synnex Corp (SNX: $79/share)
Synnex Corp (SNX), business process service provider, is one of the additions to our Most Dangerous stocks for May
Synnex is the prime example to highlight how misleading GAAP net income can be, due to numerous accounting loopholes. Since 2010, Synnex’s GAAP net income has grown from $128 million to $206 million. However, its economic earnings, the true cash flows, have declined from $6 million to $0 over the same time.
Figure 2: Synnex’s GAAP Net Income Is Misleading
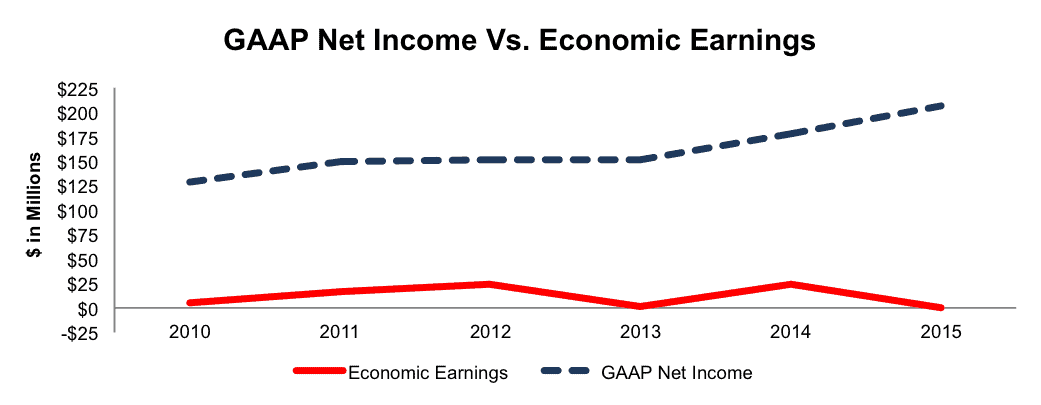
Sources: New Constructs, LLC and company filings
Synnex’s ROIC has fallen from 10% in 2010 to 8% over the last twelve months. Additionally, Synnex has generated a cumulative -$638 million in free cash flow over the past five years.
Forensic Accounting Reveals Overstated EPS
In order to derive the true recurring cash flows, an accurate invested capital, and a real shareholder value, we made the following adjustments to Synnex’s 2015 10-K:
Income Statement: we made $72 million of adjustments with a net impact of removing $34 million in non-operating expenses. We removed $53 million in non-operating expenses and $19 million in non-operating income. You can see all the adjustments made to SNX’s income statement here.
Balance Sheet: we made $515 million of adjustments to calculate invested capital with a net increase of $349 million. The largest adjustment was $257 million related to operating leases. This adjustment represented 10% of reported net assets. You can see all the adjustments made to SNX’s balance sheet here.
Valuation: we made $976 million of adjustments with a net effect of decreasing shareholder value by $976 million. There were no adjustments that increased shareholder value. The largest adjustment was the removal of $946 million in fair value of debt. This adjustment represents 30% of Synnex’s market cap.
SYN Is Priced For Significant Profit Growth
Despite the clear value destruction over the past five years, significant profit growth is already priced into SYN, which makes the stock one to avoid. To justify its current price of $79/share, SYN must grow NOPAT by 10% compounded annually for the next 12 years. In this scenario, the company could be generating over $41 billion in revenue 12 years from now, greater than Oracle’s 2015 revenue.
If Synnex can grow NOPAT by 4% compounded annually for the next decade, the stock is still worth only $56/share today – a 30% downside.
This article originally published here on May 10, 2016
Disclosure: David Trainer and Kyle Guske II receive no compensation to write about any specific stock, style, or theme.