We closed this position on August 14, 2019. A copy of the associated Position Update report is here.
Despite its price doubling since early 2015, this industry leader still has room to run. With improving profitability, strong industry growth, and an undervalued share price, this stock could outperform moving forward. Hasbro Inc. (HAS: $105/share) is this week’s Long Idea.
Hasbro Consistently Improves Profitability
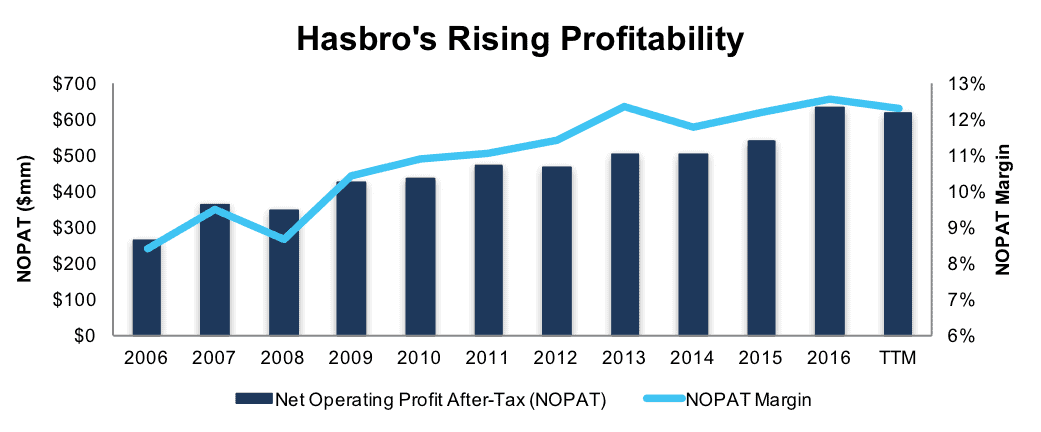
Hasbro has grown revenue 5% compounded annually over the past decade. Over the same time, after-tax profit (NOPAT) has increased 9% compounded annually. Profit growth has been fueled by HAS’ improving NOPAT margin, which has improved from 8% in 2006 to 12% TTM per Figure 1. Longer-term, Hasbro has grown NOPAT by 7% compounded annually since 1998.
Figure 1: HAS Profitability Improvement Since 2006
Sources: New Constructs, LLC and company filings
In addition to NOPAT growth, Hasbro has generated a cumulative $2.5 billion (19% of market cap) in free cash flow (FCF) over the past five years. Hasbro’s $757 million in FCF over the last twelve months equates to a 5% FCF yield. Hasbro has also exhibited good stewardship of capital and has earned a double digit return on invested capital (ROIC) every year for the past decade. HAS currently earns a 17% ROIC, which is in the top-quintile of our coverage universe.
Executive Compensation Plan Is Directly Aligned With Creating Shareholder
Hasbro’s executive compensation plan includes base salary, annual incentives, and long-term stock based compensation. One-third of performance share awards, which make up 50% of long-term incentive compensation, are tied to average return on invested capital over a three-year period. ROIC was added to Hasbro’s executive compensation plan in 2015 based on shareholder feedback.
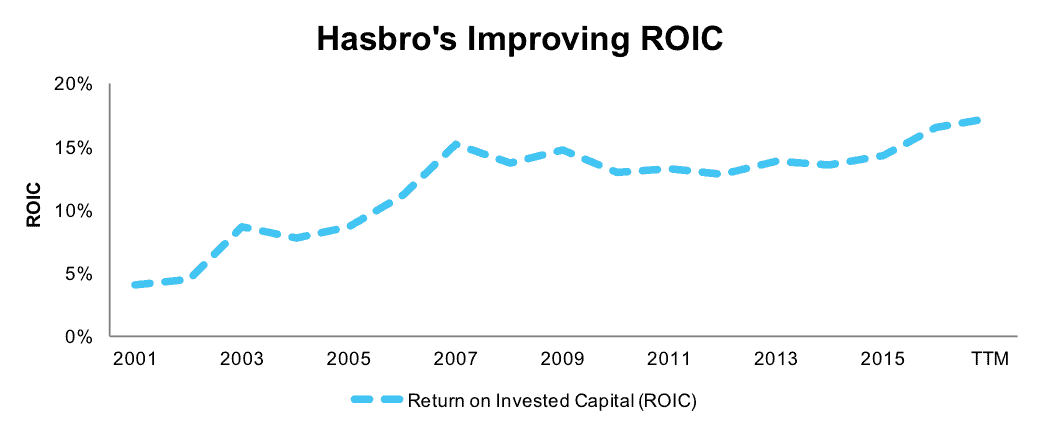
The new focus on ROIC helps ensure executives continue to be good stewards of capital. Per Figure 2, Hasbro’s ROIC has improved from 4% in 2001 to 17% TTM. In addition, Hasbro has grown economic earnings from -$102 million in 2001 to $438 million TTM.
Figure 2: Hasbro’s Exec Comp Plan Drives Rising ROIC
Sources: New Constructs, LLC and company filings
We know from Figure 3 below, and numerous case studies, that ROIC is directly correlated to changes in shareholder value. HAS’ use of ROIC to measure performance ensures executives’ interests are aligned with shareholders’ interests and earns it a spot on May’s Exec Comp Aligned with ROIC Model Portfolio.
Improving ROIC Correlated with Creating Shareholder Value
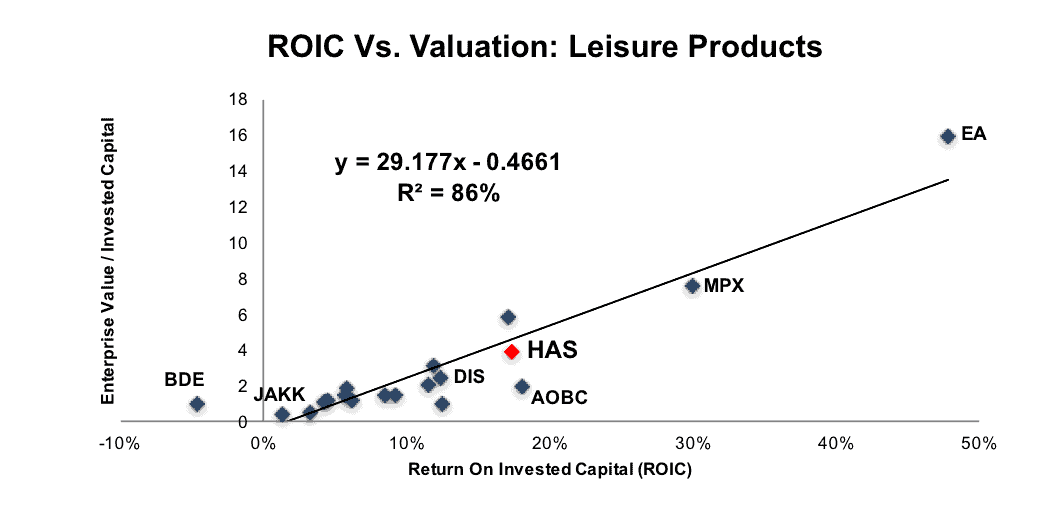
Per Figure 3, ROIC explains 86% of the changes in valuation for the 19 Leisure Product peers under coverage. Despite HAS’ 17% ROIC, above the 12% average of the peer group, the firm’s stock trades at a discount to peers as shown by its position below the trend line in Figure 3. If the stock were to trade at parity with its peers, it would be $123/share – 17% above the current stock price. Given the firm’s rising ROIC, shareholder-aligned exec comp plan, and consistent profit growth, one would think the stock would garner a premium valuation.
Figure 3: ROIC Explains 86% Of Valuation for Leisure Product Firms
Sources: New Constructs, LLC and company filings
Hasbro’s Profitability Helps Build Market Leading Position
As a leader in the toy and game market, Hasbro’s biggest competition comes from Mattel Inc. (MAT), the maker of Barbie and Hot Wheels. Per Figure 4, Hasbro’s NOPAT margin and ROIC rank well above Mattel and near the top of peers such as JAKKS Pacific (JAKK) and leisure product firms Escalade (ESCA) and Callaway Golf (ELY).
Hasbro’s licensing model, which includes deals with Walt Disney Company (DIS) and DreamWorks, and its in-house brands, Monopoly, My Little Pony, Nerf, and Play-Doh among others, provide many profitable business lines. High margins have allowed HAS to invest profits into developing new products, such as new NERF toys or even short video series’ that tie into its existing brand names. At the same time, Hasbro is able to withstand pricing pressures from Mattel and other game makers, or look to lower its own prices in an effort to gain market share. Most importantly, high margins allow Hasbro to bid competitively for lucrative licensing deals, such as the current deal with Disney running through 2020.
Figure 4: Hasbro’s Profitability Ranks Highly Among Peers
Sources: New Constructs, LLC and company filings.
Bear Concerns Focus on Diminished Toy Sales At Home & Abroad
On a macro level, the U.S. economy is steadily improving. Wages are slowly rising, unemployment remains low, and consumer spending is growing. Each of these macro trends creates a positive business environment for Hasbro.
On a more micro level, Hasbro’s operations are heavily tied to the growth of the overall toy industry. While bears may argue that Hasbro’s success is simply a result of recent movie releases that can’t be replicated in the future, its long history of profit growth suggests otherwise. Additionally, the toy industry, both in the U.S. and across the globe, has achieved consistent growth in recent years. Key categories for Hasbro have also grown well above industry averages, which also bodes well for the firm’s future profit potential.
Global toy sales have grown 4% compounded annually over the past three years, surpassing a record $90 billion in 2016. Hasbro generated 44% of its revenues from its International segment in 2016 and was able to grow sales 11% year-over-year, well above industry average. According to NPD Group, a significant portion of global toy sales are driven by licensed toys, which makes Hasbro’s licensing deal with Disney even more valuable on the global stage.
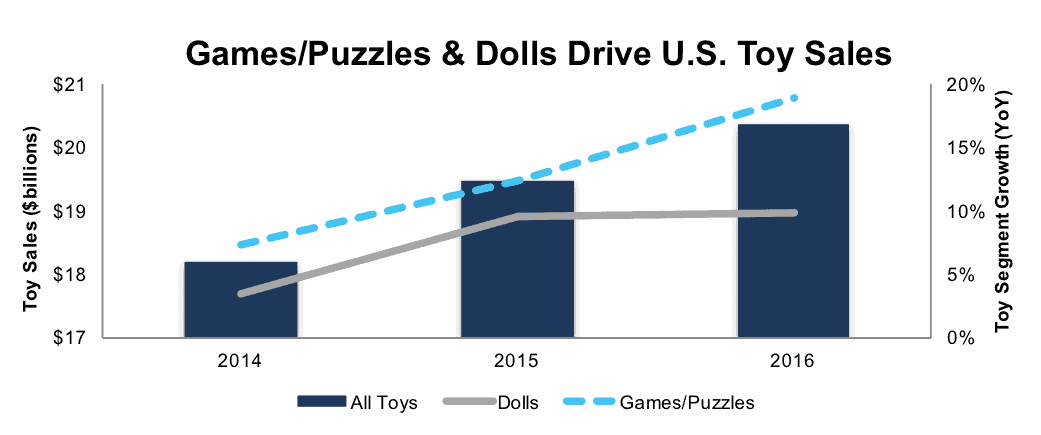
Per Figure 5, U.S. toy industry sales have grown from $18.2 billion in 2014 to $20.4 billion in 2016, or 6% compounded annually. U.S. & Canada sales represented 51% of Hasbro’s revenue in 2016. More importantly, the Games/Puzzles and Dolls segments have grown well above industry average over the past three years. Games/Puzzles grew 16% compounded annually since 2014 while Dolls grew 10% compounded annually. These segments are key to Hasbro, with Games and Girls (which includes Hasbro’s doll lineup) segments representing 28% and 24% of 2016 revenue respectively. Ultimately, over half of Hasbro’s revenues are in the fastest growing segments in the toy industry.
Figure 5: Toy Industry’s Continued Growth Since 2014
Sources: New Constructs, LLC
Bears may raise concerns about Hasbro’s customer concentration. In 2016, Wal-Mart (WMT), Toys “R” Us, and Target (TGT) accounted for 18%, 9%, and 9% of revenue respectively. Such concentration would be more concerning if it were based on one individual product at one specific store. At the same time, the reality is that the distribution of toys is heavily concentrated through those channels. Nevertheless, Hasbro’s offerings are spread across numerous products, each reliant upon its own brand success and less upon the success of a specific retailer. On the other hand, customer concentration can also provide cost benefits, such as distribution efficiency or lower cost of sales.
Lastly, HAS’ low valuation undermines many bear arguments. Despite improving profitability, upcoming product releases (detailed below) and strong economic trends, HAS’ current valuation implies meager profit growth, as we’ll show below.
Despite Price Increase, HAS Remains Undervalued
HAS is up 36% year-to-date while the S&P is up 8%. Since our initial feature on Hasbro in January 2015, the stock is up 103% while the S&P is up 20%. Despite the rising share price, HAS still presents quality upside potential and remains undervalued. At its current price of $105/share, HAS has a price-to-economic book value (PEBV) ratio of 1.2. This ratio means the market expects Hasbro’s NOPAT to grow by only 20% over the remainder of its corporate life. This expectation seems overly pessimistic for a firm that has grown NOPAT by 9% compounded annually over the past decade and 7% compounded annually since 1998.
If HAS can maintain TTM NOPAT margins (12%) and grow NOPAT by just 5% compounded annually for the next decade, the stock is worth $133/share today – a 27% upside. This scenario assumes HAS can grow revenue by consensus estimates in 2017 (8%) and 2018 (3%), and 5% each year thereafter, which equals the compound annual revenue growth rate over the past 10 years. With new film releases spurring toy demand, a growing overall toy market, and new product releases, HAS could easily meet or surpass these expectations. Add in the potential 3% yield detailed below, and it’s clear why HAS could be a great portfolio addition.
Buy Backs Plus Dividend Could Yield Over 3%
Hasbro repurchased $151 million and $85 million of its stock in 2016 and 2015 respectively. Through April 2017, the company repurchased $18 million and had nearly $310 million remaining under its current authorization. Going forward, if HAS were to average the last two years repurchase activity ($118 million per year), the firm’s existing authorization would last just under three years. A repurchase of this size is 1% of the current market cap. When combined, Hasbro’s 1% repurchase yield and 2.2% dividend yield offer investors a total potential yield of over 3%.
New Products and Releases Could Spur Earnings Surprise
Hasbro is able to tap into the enormous popularity of blockbuster film franchises by combining in-house brands such as Transformers, with licensed products such as Disney Princesses, Star Wars, and Marvel. These franchises spur demand without requiring heavy capital investment to create original content. New products, such as action figures, released alongside these films provide a significant revenue and profit growth opportunity for Hasbro. The film lineup through 2017 looks promising as well:
- Beauty and the Beast – March 17
- Guardians of the Galaxy Vol. 2 – May 5
- Transformers: The Last Knight – June 21
- Spider-Man: Homecoming – July 7
- My Little Pony: The Movie – October 6
- Thor: Ragnarok – November 3
- Star Wars: The Last Jedi – December 15
Best of all, these movie properties are being expanded with multiple future releases already in the works. For instance, Michael Bay, director of the Transformers movies, noted in early May that there have been 14 separate stories written for potential movies. An additional Star Wars movie is planned for a 2019 release, along with spin-off stories on Han Solo and possibly Bobba Fett in 2018 and 2020. According to NPD Group, Star Wars was the top toy property in the world based on dollar sales in 2016.
Best of all, Hasbro’s growth opportunities expand far beyond Transformers and Disney. The company is introducing new NERF products, expanding its Magic: The Gathering lineup, and even developing digital products through its ownership of mobile game developer Backflip Studios. Additionally, Hasbro continues investing in top brands such as Monopoly and Play-Doh.
HAS is well positioned to capitalize on the growth of the toy market and do so profitably, with its leading margins per Figure 4 above. Beating both top and bottom line expectations, as it has done for six consecutive quarters, should prove an effective catalyst to send shares higher. When HAS beat both top and bottom line expectations in 4Q16, the stock rose 18% over the following week. When Hasbro surpassed expectations again in 1Q17, the stock rose 6% the following day.
HAS could be poised for another beat and subsequent increase in valuation. In the meantime, investors in this stock carry very low valuation risk and are rewarded with a potential 3% total yield given HAS’ history of dividends and share repurchases.
Insider Trends and Short Interest Are Minimal
Over the past 12 months, there have been 269 thousand insider shares purchased and 165 thousand insider shares sold for a net effect of 103 thousand insider shares purchased. These purchases represent less than 1% of shares outstanding. Additionally, short interest sits at 5.2 million shares, or 4% of shares outstanding.
Impact of Footnotes Adjustments and Forensic Accounting
Our Robo-Analyst technology enables us to perform forensic accounting with scale and provide the research needed to fulfill fiduciary duties. In order to derive the true recurring cash flows, an accurate invested capital, and an accurate shareholder value, we made the following adjustments to Hasbro’s 2016 10-K:
Income Statement: we made $258 million of adjustments, with a net effect of removing $80 million in non-operating expense (2% of revenue). We removed $89 million in non-operating income and $169 million in non-operating expenses. You can see all the adjustments made to HAS’s income statement here.
Balance Sheet: we made $3 billion of adjustments to calculate invested capital with a net increase of $355 million. The largest adjustment was $481 million due to asset write-downs. This adjustment represented 14% of reported net assets. You can see all the adjustments made to HAS’s balance sheet here.
Valuation: we made $2.9 billion of adjustments with a net effect of decreasing shareholder value by $752 million. Apart from total debt, which includes $132 million in operating leases, the largest adjustment was $1.2 billion in excess cash. This cash adjustment represents 9% of HAS’s market cap. Despite the net decrease in shareholder value, HAS remains undervalued.
Attractive Funds That Hold HAS
The following funds receive our Attractive-or-better rating and allocate significantly to HAS.
- Touchstone Mid Cap Fund (TMCPX) – 3.9% allocation and Attractive rating.
- EcoLogical Strategy ETF (HECO) – 3.0% allocation and Very Attractive rating.
- AIG ESG Dividend Fund (EDFWX) – 2.9% allocation and Very Attractive rating.
- Congress Mid Cap Growth Fund (IMIDX) – 2.5% allocation and Attractive rating.
This article originally published on June 5, 2017.
Disclosure: David Trainer and Kyle Guske II receive no compensation to write about any specific stock, style, or theme.
Follow us on Twitter, Facebook, LinkedIn, and StockTwits for real-time alerts on all our research.
Click here to download a PDF of this report.
Photo Credit: Annie Roi (Flickr)


1 Response to "One Of the Best Plays In Today’s Stock Market"
HAS jumps 6% after 4Q earnings. Hasbro is in our Focus List Long and Exec Comp Aligned with ROIC Model Portfolios