
Check out this week’s Danger Zone interview with Chuck Jaffe of Money Life.
We base our mutual fund ratings on our analysis of fund holdings. This diligence allows us to determine whether or not a fund is sticking to its stated stock-picking methodology. This week, we’ve identified a fund whose holdings do not fit its methodology.
Despite its 4 and 5-Star Morningstar rating (depending upon share class), Transamerica Capital Growth Fund (IALAX) is one of the worst rated funds in our ~7,000 ETF and mutual fund coverage universe. IALAX is in the Danger Zone.
Backwards Looking Research Overrates this Fund
Investors that rely solely on past performance may not see the true risk of investing in this fund. Per Figure 1, IALAX, ILLLX, and TCPWX earn the 4-Star rating from Morningstar and TFOIX earns the 5-Star rating.
IALAX, along with ILLLX and TFOIX get our Very Unattractive Rating, the worst of our Predictive Risk/Reward Fund ratings, which leverage our core earnings and earnings distortion[1] research featured in this Harvard Business School and MIT Sloan paper.
Figure 1: Transamerica Capital Growth Fund Ratings
Sources: New Constructs, LLC, company, ETF and mutual fund filings, and Morningstar
IALAX allocates significant capital to companies with low profitability and high profit growth expectations baked into their stock prices, which makes its portfolio unusually risky.
Holdings Research Reveals a Low-Quality Portfolio
The only justification for a mutual fund to charge higher fees than its ETF benchmark is “active” management that leads to out-performance. A fund is most likely to outperform if it has higher quality holdings than its benchmark. To assess holdings quality, we leverage our Robo-Analyst technology[2] to drill down and analyze the individual stocks in every fund we cover.
Per Figure 2, Transamerica Capital Growth Fund’s asset allocation poses greater downside risk and holds less upside potential than its benchmark, the iShares Core S&P U.S. Growth ETF (IUSG).
IALAX allocates just 5% of its portfolio to Attractive-or-better rated stocks compared to 26% for IUSG. On the flip side, IALAX’s exposure to Unattractive-or-worse rated stocks is much higher, at 85% versus IUSG at 33%.
Figure 2: IALAX Allocates Capital to More Low-Quality Holdings
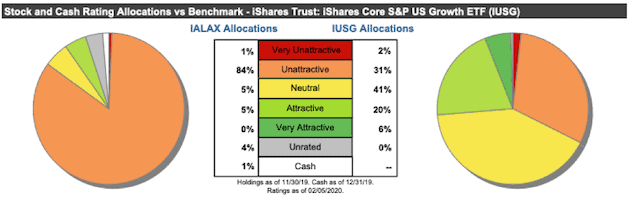
Sources: New Constructs, LLC and company, ETF and mutual fund filings
Given the unfavorable allocation of Very Attractive vs. Very Unattractive stocks relative to the benchmark, IALAX appears poorly positioned to generate the outperformance required to justify its fees.
Stock Selection Methodology Looks Good on Paper
On its surface, Transamerica Capital Growth Fund’s investment process looks like a winner. The fund’s prospectus notes the advisors “emphasize a bottom-up stock selection process” that focuses on:
- Companies with rising returns on invested capital
- Above average business visibility
- Strong free cash flow generation
- Attractive risk/reward
We love seeing funds that pick stocks based on return on invested capital (ROIC). We’ve written extensively on how improving ROIC creates shareholder value. Additionally, ROIC does a better job of explaining changes in shareholder value than any other metric, including commonly used metrics such as price-to-book (P/B), price-to-earnings (P/E), return-on-equity (ROE), and enterprise value to EBITDA. An investment process that emphasizes improving ROIC should find better stocks than one using flawed traditional metrics.
Stock Selection Methodology Looks Bad in Practice
In practice, IALAX’s process does not find better stocks. There are two possible causes for the disconnect between the fund’s stated methodology and its actual holdings: (1) bad data in their ROIC models or (2) straying from the methodology.
We know getting ROIC right is hard. The calculation seems simple, but to calculate an accurate ROIC, one must make dozens of adjustments to remove non-core and non-recurring items from reported earnings. Without making these adjustments, one gets a flawed measure of ROIC.
Professors from HBS and MIT Sloan show in Core Earnings: New Data & Evidence that our research does a much better job of identifying unusual items than “Special Items” from Compustat and “Street Adjustments” from IBES. This paper compares our research on a mega cap company to Bloomberg and Capital IQ (SPGI) in a detailed appendix.
By leveraging our superior dataset, instead of the 40-year old databases of flawed data, we find that IALAX allocates to stocks with significantly lower ROICs than the benchmark and overall market (S&P 500). Making matters worse, our research finds that IALAX’s holdings also have higher expectations for future profit growth.
Figure 3 contains our detailed rating for IALAX, which includes each of the criteria we use to rate all funds under coverage. These criteria are the same for our Stock Rating Methodology because the performance of a fund’s holdings equals the performance of a fund after fees.
Figure 3: Transamerica Capital Growth Fund Rating Breakdown
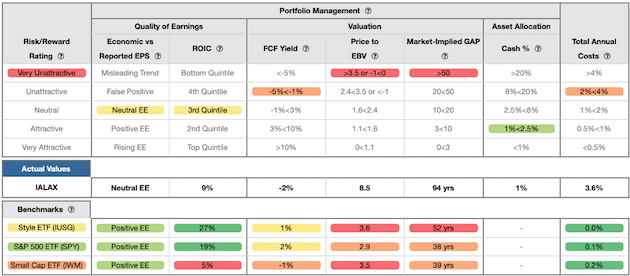
Sources: New Constructs, LLC and company, ETF and mutual fund filings
As Figure 3 shows, IALAX’s holdings are inferior to its benchmark, IUSG, in all five of the criteria that make up our holdings analysis. Specifically:
- IALAX’s return on invested capital (ROIC) is 9% and well below the 27% earned by IUSG and the 19% earned by the S&P 500 (SPY).
- IALAX’s free cash flow yield of -2% is worse than the 1% of IUSG and 2% of SPY.
- The price to economic book value (PEBV) ratio for IALAX is 8.5, which is significantly greater than the 3.6 for IUSG holdings and the 2.9 of SPY holdings.
- Our discounted cash flow analysis reveals an average market implied growth appreciation period (GAP) of 94 years for IALAX’s holdings compared to 52 years for IUSG and 38 years for SPY.
The stocks held by IALAX generate inferior cash flows and have higher valuations compared to IUSG. The market expectations for stocks held by IALAX imply profit growth (measured by PEBV ratio) that is more than double the profit growth expectations embedded in IUSG’s holdings. Lower historical profits and higher expectations for future profits are a bad combination.
Deep Dive on IALAX’s Bad Stock Holdings
IALAX’s holdings include the usual large cap stocks that one must hold to even attempt to track the market – Amazon (AMZN), Facebook (FB), and Alphabet (GOOGL). Outside of these companies, IALAX’s holdings include many previous Danger Zone picks such as Workday (WDAY), Spotify (SPOT), Slack Technologies (WORK), Peloton Interactive (PTON), Snap Inc. (SNAP), Uber Technologies (UBER), and more.
Workday (WDAY: $188/share) is one of IALAX’s worst holdings due to its lack of profitability, declining ROIC, and overvalued stock price. It also highlights the IALAX straying from its stated process. WDAY’s GAAP losses have increased from -$248 million in 2015 to -$457 million TTM. Core earnings, which account for non-core and non-recurring items in financial filings, have deteriorated even faster, from -$216 million to -$486 million over the same time.
Economic earnings, which not only account for non-core items on the income statement, but also changes to the balance sheet, look even worse. Economic earnings have declined from -$345 million in 2015 to -$691 million TTM despite revenue more than tripling over the same time. See Figure 4.
Figure 4: WDAY’s Economic Earnings & Revenue Since 2015
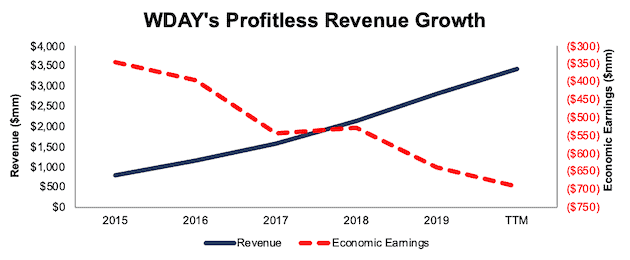
Sources: New Constructs, LLC and company filings
WDAY’s ROIC has also been negative throughout its time as a public company, and is declining in recent years. After topping out at -11% in 2018, WDAY’s ROIC has fallen to -18% TTM.
WDAY is Significantly Overvalued
Despite the deterioration in WDAY’s fundamentals, shares are up ~52% over the past two years (S&P 500 +22%) and are significantly overvalued. We use our reverse DCF model to quantify the growth in cash flows WDAY must achieve to justify its valuation.
To justify its current price of $188/share, WDAY must immediately achieve a 14% NOPAT margin (average of 61 Software firms under coverage with a positive NOPAT margin – compared to -13% TTM) and grow revenue by 23% compounded annually for the next 14 years. See the math behind this reverse DCF scenario. In this scenario, WDAY would be generating $52 billion in revenue 14 years from now, which today would rank behind only Microsoft in terms of annual revenue out of the 115 Software firms under coverage.
Even if we assume WDAY can achieve a 14% NOPAT margin and grow revenue by 20% compounded annually (consensus estimate for 2021) for the next decade, the stock is worth only $83/share today – a 56% downside. See the math behind this reverse DCF scenario.
Excessive Fees Make Outperformance Even More Difficult
At 3.57%, IALAX’s total annual costs (TAC) are higher than 93% of the 537 All Cap Growth mutual funds under coverage. For comparison, the average TAC of all All Cap Growth mutual funds under coverage is 1.69%, the weighted average is 1.46%, and the benchmark ETF (IUSG) has total annual costs of 0.04%.
Our TAC metric accounts for more than just expense ratios. We consider the impact of front-end loads, back-end loads, redemption fees, and transaction costs. For example, IALAX’s front-end load adds 2.09% to its total annual costs and its annual turnover ratio of 90% adds 0.19% to its total annual costs – neither of which are captured by the expense ratio. Figure 5 shows our breakdown of IALAX’s total annual costs, which is available for all of the ~7,000 mutual funds under coverage.
Figure 5: Transamerica Capital Growth Fund Total Annual Costs Breakdown
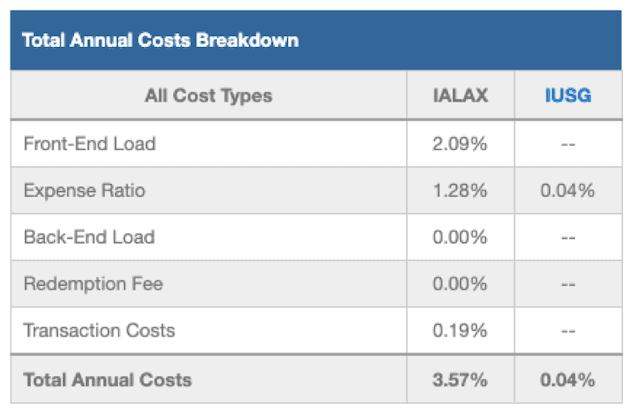
Sources: New Constructs, LLC and company, ETF and mutual fund filings
To justify its higher fees, each class of the fund must outperform its benchmark by the following over three years:
- IALAX must outperform by an average of 3.52% annually.
- ILLLX must outperform by an average of 2.24% annually.
- TFOIX must outperform by an average of 1.12% annually.
- TCPWX must outperform by an average of 1.01% annually.
An in-depth analysis of IALAX and its TAC is available in our standard mutual fund report.
IALAX’s Performance Can’t Justify Its Fees
When we take into account its load, which adds 2.09% to its total annual costs, we see that IALAX has failed to outperform enough to justify its fees.
IALAX’s 1-year quarter-end average annual total return underperformed IUSG by nearly16 percentage points. Its 3-year quarter-end average annual total return bested IUSG by 274 basis points, which is not enough to justify its fees, as noted above. Its 5 and 10-year quarter-end average annual total return each bested IUSG by even less, at 63 and 82 basis points.
Given that 85% of assets are allocated to stocks with Unattractive-or-worse ratings, IALAX looks likely to underperform moving forward.
The Importance of Holdings-Based Fund Analysis
Smart fund (or ETF) investing means analyzing the holdings of each mutual fund. Failure to do so is a failure to perform proper due diligence. Simply buying a mutual fund or ETF based on past performance does not necessarily lead to outperformance. Only through holdings-based analysis can one determine if a fund’s methodology leads managers to pick high-quality or low-quality stocks.
However, most investors don’t realize they can access sophisticated fundamental research using data that corrects market inefficiencies and generates alpha. Our Robo-Analyst technology analyzes the holdings of all 537 ETFs and mutual funds in the All Cap Growth style and ~7,000 ETFs and mutual funds under coverage to avoid “the danger within.[3]” This diligence allows us to cut through the noise and identify potentially dangerous funds that traditional backward-looking fund research may overlook, such as IALAX.
Better Rated All Cap Growth Funds
The following All Cap Growth mutual funds earn an Attractive-or-better rating, have more than $100 million in assets under management, and have below average TAC.
- Nuveen Large Cap Growth Fund (NLAFX) – Very Attractive – 0.99% TAC
- Nuveen Large Cap Growth Fund (NLIGX) – Very Attractive – 1.09% TAC
- Delaware Growth Equity Fund (FICIX) – Very Attractive – 0.92% TAC
This article originally published on February 10, 2020.
Disclosure: David Trainer, Kyle Guske II, and Matt Shuler receive no compensation to write about any specific stock, sector, style, or theme.
Follow us on Twitter, Facebook, LinkedIn, and StockTwits for real-time alerts on all our research.
[1] In Core Earnings: New Data & Evidence, professors at Harvard Business School (HBS) & MIT Sloan empirically show that our “novel dataset” is superior to “Street Earnings” from Refinitiv’s IBES, owned by Blackstone (BX) and Thomson Reuters (TRI), and “Income Before Special Items” from Compustat, owned by S&P Global (SPGI).
[2] Harvard Business School features the powerful impact of our research automation technology in the case study New Constructs: Disrupting Fundamental Analysis with Robo-Analysts.
[3] This paper compares our analytics on a mega cap company to Bloomberg and Capital IQ (SPGI) in a detailed appendix.