
Check out this week’s Danger Zone Interview with Chuck Jaffe of Money Life.
For the best financial analysis ratios, look no further. Harvard Business School and MIT Sloan empirically demonstrate the superiority of the data that drives our models and calculations. This paper compares our financial analysis to Bloomberg and Capital IQ (see appendix for details).
Contracting price to earnings (P/E) ratios have “Stolen 2018” according to Josh Brown. S&P 500 companies are on track to report average earnings growth of 26.3% in 3Q18 according to the Financial Times, but the S&P 500 has dropped 3% over the past month and is up just 2% on the year. The average “earnings beat” so far this quarter has resulted in a 1.5% stock price drop.
Many investors mistakenly believe that rising GAAP earnings and falling stock prices mean the market is getting cheaper. After all, the P/E ratio of the S&P 500 has declined from 24 at the beginning of the year to 23 currently.
However, P/E ratios are not a good measure of value, and that’s especially true this year. Many companies continue to take one-time earnings boosts, and P/E ratios don’t account for the rising cost of capital. Investors that rely on P/E ratios are in the Danger Zone.
Earnings Beats Aren’t Real
We wrote after Q1 that the most earnings beats weren’t real, and that trend continues in Q3. Figure 1 shows that – for the 1,050 companies whose 10-Qs we analyzed between October 25 and November 6 – median trailing twelve months (TTM) GAAP EPS are up 22%. Meanwhile, net operating profit after tax (NOPAT) is up only 10%, and economic earnings per share – which accounts for the cost of capital – are down 9%,
Figure 1: TTM GAAP EPS, NOPAT, and Economic Earnings Growth for the Median Company
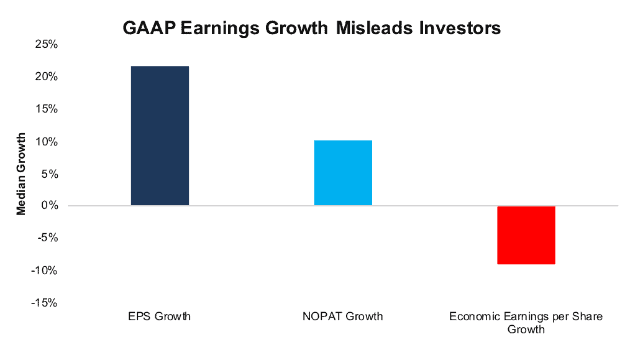
Sources: New Constructs, LLC and company filings
There are numerous reasons for NOPAT growing at less than half the rate of GAAP EPS, but the impact of tax reform remains the most significant driver of this disconnect. At the beginning of the year, we highlighted how companies with deferred tax liabilities would get a one-time boost from the change while companies with deferred tax assets would take a one-time charge. Since the companies we cover have more deferred tax liabilities than deferred tax assets, the net result has been temporarily boosted earnings.
Most of that impact was realized early on in 2018, but the effects continue. For example, Intercontinental Exchange Inc. (ICE) continued to benefit in Q3 as changes in its deferred tax liability estimates and a benefit from a recent divestment lowered its effective tax rate down to just 16%. The difference between its effective tax rate and the federal tax rate came out to $27 million, or $0.05/share, the majority of the company’s $0.08/share earnings “beat”.
Figure 1 shows that overall NOPAT is still growing, but not fast enough to offset the rising cost of capital. Rising interest rates already pushed the weighted average cost of capital (WACC) for the average S&P 500 company up from 6.1% at the end of 2017 to 6.7% in Q3. Companies may be beating expectations on the income statement, but when one accounts for the rising cost of capital, earnings are still in decline.
No Correlation Between GAAP Earnings and Value
If accounting earnings actually drove valuations, then companies with high EPS growth should command higher multiples. Conversely, companies with low or negative EPS growth should have lower PE multiples. As Figure 2 shows, there is no such correlation.
Figure 2: Earnings Growth Vs. PE Ratio for the S&P 500
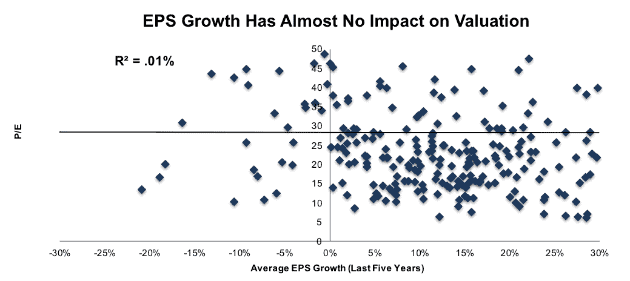
Sources: New Constructs, LLC and company filings
The r-squared value of 0.01% in Figure 2 means that EPS growth over the past five years explains just one hundredth of one percent, a statistically insignificant level, of the difference in P/E ratios between stocks in the S&P 500. Stocks can see their PE multiples expand and contract in a manner that has almost nothing to do with changes in EPS, which means other factors drive valuation.
“But wait!” you might be saying, “historical EPS growth is backward-looking metric. P/E ratios anticipate future growth.” Well, Figure 3 shows that when we use forecasted revenue growth, the r-squared value does increase… all the way to 0.6%. Growth projections still explain less than 1% of differences in P/E ratios.
Figure 3: Forecasted Revenue Growth Vs. PE Ratio for the S&P 500
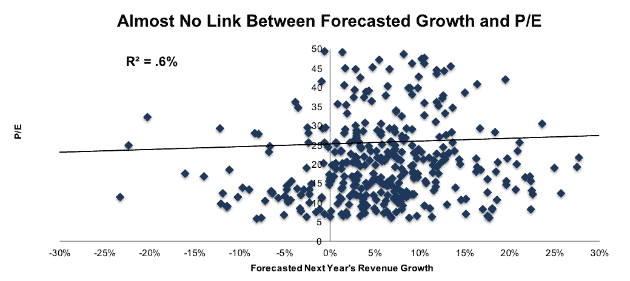
Sources: New Constructs, LLC and company filings
The Market Cares More About ROIC
Nor are we the only firm to show that valuations tend to be driven largely by return on invested capital (ROIC), the primary driver of economic earnings. Numerous case studies show that getting ROIC right is an important part of making smart investments. Ernst & Young recently published a white paper that proves the material superiority of our forensic accounting research and measure of ROIC.
Figure 4 shows that ROIC is highly correlated with Enterprise Value/Invested Capital (a cleaner version of price to book).
Figure 4: ROIC Explains 54% of Valuation for S&P 500 Stocks
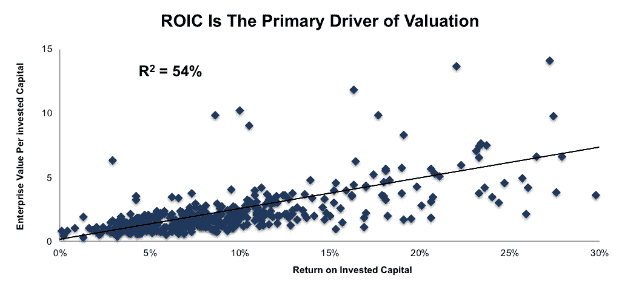
Sources: New Constructs, LLC and company filings
ROIC explains over half of the difference in valuations between various companies. This correlation means companies that improve their ROIC are more likely to see their stock prices rise.
Why Understanding Short Term Vs. Long Term Drivers Matters
It’s understandable why investors might think that earnings drive stock prices. After all, you tend to see stock prices go down when companies miss earnings expectations and go up when they beat expectations (this quarter notwithstanding).
This pattern is undeniable. Headline numbers can have an immediate and dramatic influence on stock prices. The key word in that sentence is “immediate”. A big increase in EPS might drive short-term gains in stock prices, but it doesn’t create long-term value. To understand the cause of this divergence, you have to understand the different types of investors in the market.
Brian Bushee from the Wharton School of Business wrote an excellent paper back in 2005 that highlights the behavioral differences among institutional investors. His research found that:
- 61% of institutional investors are “Quasi-Indexers”. They hold many small stakes with low turnover, so they have little impact on market valuations.
- 31% of institutional investors are “Transients”. They have small stakes but a high turnover, so their high volume of trading can impact valuations in the short term.
- 8% of institutional investors are “Dedicated”. They take large stakes and hold them for a very long time. These are the investors that drive long-term valuations.
A big earnings beat might cause a lot of “Transient” investors to buy that stock and push up the price. However, most of these investors will sell their stakes not long after, thereby sending the price back down. These transient investors act as noise traders – they buy or sell stocks based on the incomplete information of earnings reports. Meanwhile, “Dedicated” investors help drive stocks towards their fair value after reviewing the more complete information in 10-Ks and 10-Qs.
One “Value-Trap” With A Misleading P/E Ratio
Because P/E ratios rely on flawed accounting earnings and ignore the cost of capital, they can steer investors towards value traps, stocks that look cheap but are actually very expensive when taking into account the comprehensive picture of a firm’s profitability.
Intercontinental Exchange (ICE), the company with misleading earnings growth mentioned above, stands out as a risky value trap right now. The company’s artificially inflated GAAP earnings give it a low P/E ratio of 18, below the S&P 500 average of 23.
When we strip out the impact of a $764 million one-time tax benefit (29% of reported earnings) and other unusual items, we see that ICE’s NOPAT of $2 billion is 24% below its GAAP net income of $2.6 billion.
In addition, the company’s P/E ratio ignores its $2.3 billion in deferred tax liabilities (5% of market cap). These liabilities reduce the cash flows available to shareholders and need to be considered when valuing the company.
In order to justify its current valuation of ~$80/share, ICE must grow NOPAT by 10% compounded annually for the next seven years. See the math behind this dynamic DCF scenario.
If instead ICE grows NOPAT by 5% compounded annually – in line with its TTM growth rate – for the next decade, the stock is worth just $58/share today, a 27% downside from the current stock price. See the math behind this dynamic DCF scenario.
One Stock with a High P/E but Cheap Valuation
On the other side of the coin, misleading earnings mean that P/E ratios can often make cheap stocks look expensive. We featured one such stock, Colgate-Palmolive (CL) as a Long Idea earlier this year.
CL has a higher than average P/E ratio of 25 because of tax reform and restructuring charges that reduce its reported earnings. CL’s TTM NOPAT of $2.8 billion is 32% higher than its GAAP net income of $2.1 billion.
When we analyze the cash flow expectations baked into the stock price, we see that CL has a price to economic book value (PEBV) of just 1.1. This ratio means the market expects the company’s NOPAT to increase by no more than 10% over the remainder of its corporate life. By comparison, the companies in the S&P 500 have an aggregate PEBV of 1.7.
The market’s expectations for CL seem awfully low for a company that has grown NOPAT by 5% compounded annually for the past 15 years. We think that when the company’s reported earnings improve after it moves past these unusual events, investors will start to recognize CL for the true value that it is.
Even if CL’s NOPAT growth slows to 4% compounded annually over the next 15 years, the stock is worth $88/share today, a 44% upside from the current price. See the math behind this dynamic DCF scenario.
Investors who rely on P/E ratios won’t just get a misleading view of the market, they’ll mistakenly believe that an expensive stock like ICE is a value, and that a value stock like CL is expensive.
Read our previous article "Why PE Ratios Are Not A Good Measure Of Value."
This article originally published on November 12, 2018.
Disclosure: David Trainer, Kyle Guske II, and Sam McBride receive no compensation to write about any specific stock, sector, style, or theme.
Follow us on Twitter, Facebook, LinkedIn, and StockTwits for real-time alerts on all our research.