
We closed this position on November 18, 2020. A copy of the associated Position Update report is here.
After making numerous required adjustments, we found a firm whose reported 2017 earnings understate the true profit growth of the business. With a long history of dividend growth, a vertically integrated business model providing competitive advantages, and undervalued stock price, Leggett & Platt (LEG: $45/share) earns a spot in this month’s Dividend Growth Stocks Model Portfolio and is this week’s Long Idea.
LEG’s Reported Profit Understates True Profitability
Investors only analyzing reported net income may be surprised to find profits are growing even faster than they realize. In 2017, multiple non-operating expenses lowered LEG’s reported earnings. First, the company included a $50 million charge associated with the recently enacted Tax Cuts and Jobs Act in operating earnings. Second, on page 102 of LEG’s 10-K, the company disclosed a $15.3 million charge related to pension settlement losses. Combined, these two charges equaled 22% of reported GAAP net income.
By removing these non-recurring charges, we show that LEG’s profits are relatively unchanged in 2017, which contrasts with the large drop in reported GAAP net income. In 2017, LEG’s GAAP net income fell 24% year-over-year (YoY) while after-tax operating profit (NOPAT) fell less than 1% YoY.
Beyond 2017, LEG has grown revenue by 3% compounded annually since 2009 while NOPAT has grown 19% compounded annually, per Figure 1. For comparison, LEG’s GAAP net income has grown by just 13% compounded annually over that time. Longer-term, LEG has grown NOPAT by 5% compounded annually over the past decade.
Figure 1: LEG’s Revenue & Profit Growth Since 2009
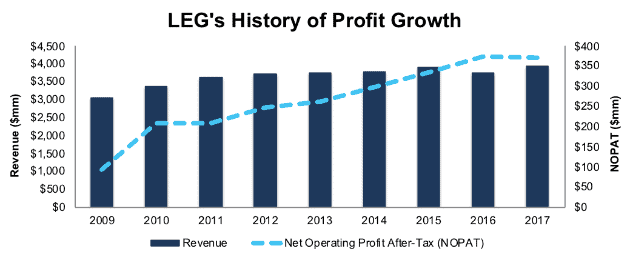
Sources: New Constructs, LLC and company filings
Improved profit growth has been fueled by rising NOPAT margins, which have improved from 3% in 2009 to 9% in 2017. At the same time, average invested capital turns, a measure of balance sheet efficiency, have increased from 0.98 in 2009 to 1.25 in 2017. Rising margins and efficient capital use have improved LEG’s return on invested capital (ROIC) from 3% in 2009 to 12% in 2017. The firm has also generated positive free cash flow each year since 2001 and a cumulative $1.4 billion (25% of market cap) in FCF over the past five years.
Executive Compensation Plan Helps Drive Shareholder Value Creation
LEG’s executive compensation plan takes necessary steps to properly align executives’ interests with those of shareholders and drive the efficient use of capital outlined above. 60% of LEG executives’ annual incentive awards are tied to return on capital employed (ROCE), which is similar to ROIC. ROCE has been a target metric in Leggett’s executive compensation plan since 2008.
Unfortunately, there are some flaws in LEG’s ROCE calculation that make it less impactful than it could be. Most importantly, LEG’s capital employed metric only includes net plant property & equipment and working capital. It does not include important components of invested capital such as goodwill, accumulated asset write-downs, or off-balance sheet operating leases.
Despite its flaws, the inclusion of ROCE means that LEG’s executive compensation plan is still better aligned with creating shareholder value than many other plans in the market. There is a strong correlation between improving ROIC and increasing shareholder value. The focus on improving ROCE, similar to ROIC, aligns interests of executives and shareholders and helps ensure prudent stewardship of capital. Since adding ROCE to its executive compensation plan, LEG’s ROIC has improved from 7% in 2008 to 12% in 2017. For reference, LEG’s 12% ROIC in both 2016 and 2017 is the highest it has been since 1999.
In addition, LEG has grown economic earnings, the true cash flows of the business from $31 million in 2008 to $183 million in 2017, or 22% compounded annually. For reference, the highest economic earnings earned pre-recession was $123 million in 2004.
LEG’s Market Leading Positions Provide Competitive Advantage
Leggett & Platt is an international manufacturer of bedding, furniture, carpet and automotive components. Individual products include mattress innersprings, wire forms, carpet foam, synthetic fabrics, seat suspensions and motion mechanisms for chairs and sofas, and support systems for automotive seating. In addition, the company provides adjustable/motorized bed bases, reclining/motion hardware to over 1500 furniture manufacturers (from individual chairs to entire seating sectionals), and heavy duty medical chairs.
The company has built its market share since first developing the steel coil bedspring in 1885. It has expanded into other furniture segments. Through strategic acquisitions and product development, LEG now acts as a single source for many furniture manufacturers. Today, the company estimates it is the largest U.S. manufacturer of bedding components, automotive seat support systems, carpet cushion, adjustable beds, and high-carbon drawn steel wire.
This competitive moat, aided by LEG’s patents and trademarks on box spring components, mattress innersprings, sofa sleeper mechanisms, wire seating forms, and more, has allowed LEG to expand its business while maintaining profitability above and beyond peers.
Per Figure 2, LEG has improved its NOPAT margins at a faster pace than the market weighted average NOPAT margin of its peer group. Despite the slight decline in margins in 2017, LEG still maintains a margin advantage over peers. This margin advantage, along with its market leading share, gives LEG greater flexibility to adjust to macro pricing concerns or invest in the business to expand its product offerings to meet the needs of its customers.
Figure 2: LEG’s Margin Advantage Since 2013
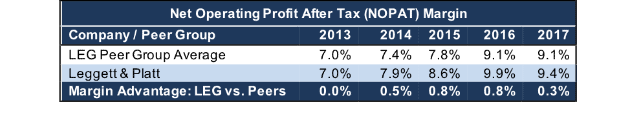
Sources: New Constructs, LLC and company filings.
Beyond traditional seating and wire manufacturers, Leggett & Platt (and the entire bedding industry) also faces competition from the likes of startups such as Casper or Tuft & Needle. While still small players in the market (estimated 0.7% and 0.4% mattress market share respectively), their rapid growth is a clear sign that foam and hybrid mattresses could be here to stay.
To coexist and compete, LEG provides products that can be integrated into these newer types of mattresses or provide an alternative. Its SomniGel product can be used as a top layer in any bedding and provides gel cushions that also dissipate heat away from the body. Its NanoCoil line is smaller than traditional coil springs and proven to last longer and resist sagging better than foam. For hybrid mattresses that don’t do away with coils entirely (such as the Sapira from Leesa) LEG provides numerous different sized coils via its ComfortCore line, which grew 8% in 2017.
Bear Case: Steel Price Concerns Have Been Successfully Mitigated Before
Leggett & Platt’s product line includes numerous items made from rod and wire steel. Because of reliance on steel, investors have been spooked by President Trump’s recent announcement of steel tariffs. Bears believe that rising steel prices due to tariffs will severely impact LEG’s profitability and future growth potential. However, these bear concerns ignore LEG’s advantages over other manufacturers and its ability to weather previous volatility in steel prices while passing raw material costs through to end customers.
First, LEG’s business model provides some insulation from rising steel prices. The firm operates its own steel rod mill, which supplies nearly all of the company’s U.S. requirements for steel wire and even sells excess to third parties. This vertical integration, while unable to completely eliminate rising steel prices, means the firm is not reliant upon third parties for the wire used in its products.
More importantly, management notes that the proposed tariffs will be more impactful on flat steel products (such as those used in automobiles), rather than rod and wire steel, the latter of which are seeing price increases due to global demand, not regulation. By owning a key factor in the manufacture of its products, LEG can better manage costs while also selling excess output at higher prices.
Second, LEG’s leading market position allows the firm to pass rising raw material costs onto its end customers. The company notes that they have experienced significant cost fluctuations in steel before. In most cases, the major changes (both increases and decreases) were passed through to customers with selling price adjustments.
It’s important to note there is a lag associated with the ability to pass-through costs because increases in selling price happen after increases in costs. However, the cost pass-through can be seen in LEG’s results. From 2014-2015, steel prices decreased significantly and, as expected, LEG’s margins improved. Then, in 2016, steel prices increased 12% year-over-year, yet LEG’s margins once again improved.
Steel prices increased rapidly throughout 2017 and margins slightly declined due to the lag associated with the ability to pass-through costs, rather than any long-term issue.
In 2016, fluctuations in price minimized the “lag effect”, as selling price grew faster than costs at certain times of the year. However, in 2017, the lag continued throughout the year as the company was continually adapting to higher costs. Management expects margins to improve throughout 2018 once the selling prices catch up with cost increases and recent history would prove such a scenario is likely, even in the face of rising steel prices.
Despite the concern, and it’s not clear if the proposed tariffs will ever be enacted (Congress is considering legislation that would stop the tariffs), LEG has proven its ability to adapt to market conditions and continually grow profits. The bear case is further weakened by LEG’s valuation. Not only does the stock not earn a premium valuation when analyzed against peers, but the stock price also implies profit growth will fall well short of historical trends, as we’ll show below.
Improving ROIC Correlated with Creating Shareholder Value
Numerous case studies show that getting ROIC right is an important part of making smart investments. Ernst & Young recently published a white paper that proves the material superiority of our forensic accounting research and measure of ROIC.
Per Figure 3, ROIC explains 74% of the difference in valuation for the 35 consumer household goods and manufacturer stocks under our coverage. LEG’s stock trades at a discount to peers as shown by its position below the trend line in Figure 3. If the stock were to trade at parity with its peers, it would be worth $49/share – an 11% upside to the current stock price. Given the firm’s improving margins and ROIC, one would think the stock would garner a premium valuation. Below we’ll use our DCF model to quantify just how high shares could rise assuming conservative profit growth.
Figure 3: ROIC Explains 74% Of Valuation for Industrial & Household Goods Manufacturers
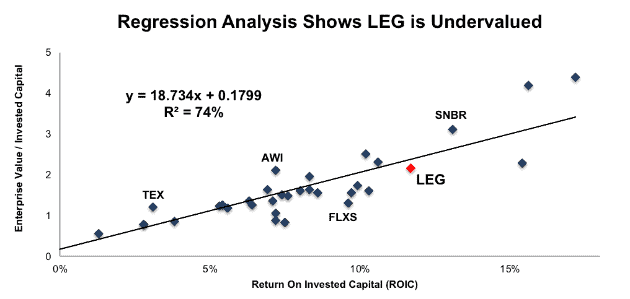
Sources: New Constructs, LLC and company filings
LEG’s Undervalued Stock Offers Quality Risk/Reward
Despite the strong fundamentals, LEG is down 8% over the past year while the S&P is up 15%. A significant portion of this underperformance occurred this year, as steel tariff concerns weighed on the market. Since mid-January, LEG is down 6% while the market is up 1%.
This drop in valuation leaves LEG significantly undervalued, both by traditional metrics and when analyzing the expectations baked into the stock price. LEG’s P/E ratio of 21.1 is equal to the Consumer Cyclicals sector average and below the S&P 500 average of 25.4. Given the history of profit growth and management expectations for future profit growth, one would think LEG would at least be valued in-line with the market. When we analyze the expectations baked into the stock price, we also find that LEG holds significant upside potential.
At its current price of $45/share, LEG has a price-to-economic book value (PEBV) ratio of 1.2. This ratio means the market expects LEG’s NOPAT to grow by no more than 20% over the remaining life of the firm. This expectation seems overly pessimistic for a firm that has grown NOPAT by 19% compounded annually since 2009 and 5% compounded annually over the past decade.
If LEG can simply maintain 2017 NOPAT margins of 9% and grow NOPAT by just 5% compounded annually for the next decade, the stock is worth $60/share today – a 30% upside. Should LEG’s margins improve, due to lowered cost inputs, or revenue growth accelerates in its end markets, the stock would hold even greater upside potential.
Strong Sales Growth in Higher Margin Segments Should Send Shares Higher
In order to continue growing its business, LEG has strategically acquired smaller businesses in an effort to increase its share in existing markets or move into entirely new markets. In 2016, LEG expanded its aerospace platform, geosynthetic fabric products, and automotive seat business through acquisitions. In 2017, LEG again acquired another geosynthetic products distributor while expanding its private-label Work Furniture business and carpet cushion business. Most recently, LEG acquired Precision Hydraulic Cylinders, a manufacturer of engineered hydraulic cylinders, which creates an entirely new business line for LEG.
Many of the acquisitions have occurred under LEG’s Specialized Products segment, which earns EBIT margins nearly double that of LEG’s other segments. Product lines within this segment are also generating a greater portion of revenue. The automotive group made up 14% of revenue in 2013 and 20% of revenue in 2017. Meanwhile, the aerospace group grew from 2% to 4% of revenue over the same time.
Furthermore, the PHC acquisition is expected to add 2% to sales in 2018. While acquisitions often destroy shareholder value, LEG has proven its ability to acquire smaller firms, increase profitability, and improve ROIC.
Overall, continued sales growth, both organically or via prudent acquisition, coupled with proven cost management should drive shares higher. Best of all, key macroeconomic indicators point to strength in LEG’s markets. Furniture/home furnishing sales and light vehicle sales remain in a long-term uptrend. The Consumer Confidence Index, which reflects consumer attitudes and buying intentions, is at its highest level since 2000. Lastly, the ISM Manufacturing Index was 60.8 in February, which is its highest levels since May 2004. Taken together, the underlying data regarding the economy and its upward trajectory should allow LEG to continue growing sales toward its 2020 goal of $5 billion.
Over Four Decades of Dividend Growth and Repurchases Provide Over 6% Yield
A long streak of dividend increases is widely considered to be a sign of a company’s strong competitive advantage. LEG has increased its annual dividend each of the past 46 years. LEG’s annual dividend has grown from $1.18/share in 2013 to $1.42/share in 2017, or 5% compounded annually. The current dividend equals a 3.3% dividend yield. This streak of growing dividend payments landed LEG on this month’s Dividend Growth Stocks Model Portfolio.
In addition to dividends, LEG has returned capital to shareholders via share repurchases. LEG has repurchased $183 million, $193 million, and $155 million in 2015, 2016, and 2017 respectively. LEG is authorized to repurchase up to 10 million shares each year but does not have an established timetable or repurchase commitment. If LEG management purchases shares in line with the averages of the past three years, it would repurchase $177 million next year. A repurchase of this size equates to 3.1% of the current market cap. When combined with the 3.3% dividend yield, the total yield to shareholders could reach 6.4%.
Insider Trading is Minimal While Short Interest Shows Market Pessimism
Insider activity has been minimal over the past three months with 78 thousand shares purchased and 77 thousand shares sold for a net effect of one thousand shares purchased. These sales represent less than 1% of shares outstanding. There are currently 9 million shares sold short, which equates to 7% of shares outstanding and 4.5 days to cover. Short interest has fallen 9% from the prior month. Future earnings beats could send shares higher and cause a short squeeze.
Auditable Impact of Footnotes & Forensic Accounting Adjustments
Our Robo-Analyst technology enables us to perform forensic accounting with scale and provide the research needed to fulfill fiduciary duties. In order to derive the true recurring cash flows, an accurate invested capital, and an accurate shareholder value, we made the following adjustments to Leggett & Platt’s 2017 10-K:
Income Statement: we made $194 million of adjustments, with a net effect of removing $79 million in non-operating expense (2% of revenue). We removed $58 million in non-operating income and $136 million in non-operating expenses. You can see all the adjustments made to LEG’s income statement here.
Balance Sheet: we made $1.5 billion of adjustments to calculate invested capital with a net increase of $593 million. The most notable adjustment was $534 million in asset write-downs. This adjustment represented 21% of reported net assets. You can see all the adjustments made to LEG’s balance sheet here.
Valuation: we made $1.9 billion of adjustments with a net effect of decreasing shareholder value by $1.2 billion. Apart from $1.4 billion in total debt, which includes $113 million in operating leases, the largest adjustment to shareholder value was $329 million in excess cash. This cash adjustment represents 6% of LEG’s market cap. Despite the net decrease in shareholder value, LEG remains undervalued.
Attractive Funds That Hold LEG
The following funds receive our Attractive-or-better rating and allocate significantly to Leggett & Platt.
- Royce Special Equity Multi-Cap Fund (RSEMX) – 3.0% allocation and Very Attractive rating.
- Ivy Mid Cap Income Opportunities Fund (IVOSX) – 2.8% allocation and Attractive rating.
- State Street SPDR S&P Homebuilders ETF (XHB) – 2.5% allocation and Very Attractive rating.
- Commerce Funds Value Fund (CFVLX) – 2.0% allocation and Attractive rating.
This article originally published on March 7, 2018.
Disclosure: David Trainer and Kyle Guske II receive no compensation to write about any specific stock, style, or theme.
Follow us on Twitter, Facebook, LinkedIn, and StockTwits for real-time alerts on all our research.
Click here to download a PDF of this report.
Photo Credit: geralt (Pixabay)