
Check out this week’s Danger Zone interview with Chuck Jaffe of Money Life.
As the market reaches record highs every few days, the time has come for investors to closely examine the risk in their portfolios. Already pricing in a significant rebound in Core Earnings[1], the S&P 500 is more expensive than any time since 2004. Even seemingly strong sectors, such as Technology, have bad stocks.
While some traders may see the recent price performance and upward momentum as reason for doubling down, fiduciaries need to take a closer look at their holdings. Price momentum is no justification for allocating client assets into a particular stock.
This report highlights three of the Most Dangerous Stocks for Fiduciaries. Each earns an Unattractive rating, has negative Core Earnings, and valuations that imply unrealistic growth in profits and market share.
Uber Technologies (UBER: $53/share), Tesla Inc. (TSLA: $610/share), DoorDash (DASH: $175/share), and the fiduciaries who are to recommend or own them, are in the Danger Zone.
Most Dangerous Stocks for Fiduciaries
Figure 1 shows that most of the ideas published in our “Most Dangerous Stocks for Fiduciaries” articles have underperformed the S&P 500 as shorts since being published.
Figure 1: Most Dangerous Stocks for Fiduciaries vs. S&P 500 – Prices Through December 11, 2020
Sources: New Constructs, LLC and company filings.
*Performance measured from DoorDash’s opening price of $182/share on December 9, 2020.
These 13 stocks are not only overvalued, but the underlying fundamentals are weak and/or trending in the wrong direction. Further, each company shares many of the following traits:
- Low or negative core earnings
- Inferior return on invested capital (ROIC), NOPAT margin, and/or invested capital turns compared to peers
- Lack of competitive advantages or defensible moat
- Valuations that imply taking significant market share, sometimes greater than the total addressable market (TAM).
Below we detail the expectations baked into the stock prices of Uber, Tesla, and DoorDash to illustrate the extreme risk in owning these stocks. As we’ll show, these stocks are more than priced to perfection and any strategic misstep or hiccup in a return to normalcy post COVID-19 (or an actual return to normalcy in DoorDash’s case), could send shares reeling.
Uber Technologies (UBER) – Unattractive Rating
Read the entire report here: The Emperor Has No Clothes – Uber’s Business Model Is Broken
We put Uber in the Danger Zone on August 24, 2020. Since then, stock is up 73% (S&P 500 +7%) with most of the gain coming after California voters approved a measure allowing Uber (and its competition) to continue classifying drivers as independent contractors.
The big problem: Uber’s business model was broken even before the recent vote and nothing about its model has changed since then. However, with the big increase in price, the risk of owning UBER is even greater than before.
Current Price Implies >100% Market Share: Given the weakness in its core rides business, declining take rates, negative profitability, and the prolonged economic downturn, we think Uber shares can fall much further. When we use our reverse discounted cash flow (DCF) model to analyze the expectations implied by the stock price, UBER appears significantly overvalued.
To justify its current price of $53/share, Uber must immediately:
- Improve its pre-tax margin to 4% (compared to -35% TTM), which is similar to airlines prior to consolidation and
- grow revenue by 32% compounded annually for the next 11 years.
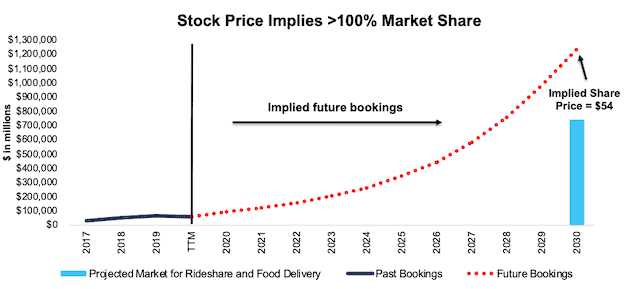
See the math behind this reverse DCF scenario. In this scenario, Uber would earn nearly $75 billion in revenue in 2025 and $227 billion in 2029. At its TTM take rate, this scenario equates to over $1.2 trillion in gross bookings in 2030. For reference, UBS estimates the global food delivery market will be worth $365 billion in 2030 and Goldman Sachs estimates the ride-hailing market will be worth ~$375 billion in 2030 for a combined TAM of $740 billion.
In other words, to justify its current stock price, Uber must capture over 150% of the projected 2030 rideshare and food delivery markets combined, per Figure 2.
Figure 2 compares the firm’s implied future bookings ($697 billion in 2029) in this scenario to its historical bookings, along with the expected TAM of ridesharing and food delivery in 2030.
For reference, as of October 2020, Uber holds ~70% of the U.S. rideshare market and ~30% of the U.S. food delivery market, which includes the recent acquisition of Postmates.
Figure 2: Current Valuation Implies 167% Market Share in 2030
Sources: New Constructs, LLC, company filings, UBS, and Goldman Sachs.
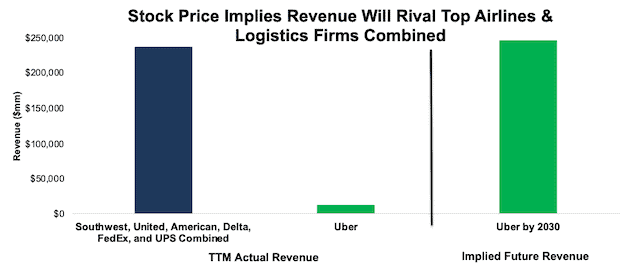
For comparison, we compare the revenue implied by Uber’s stock price to the largest airlines by passengers carried and logistics firms FedEx (FDX) and United Parcel Service (UPS) in Figure 3. Uber’s current stock price implies its revenue ten years from now will be 4% greater than the combined TTM revenue of Delta (DAL), American (AAL), United (UAL), Southwest (LUV), FedEx, and United Parcel Service.
Figure 3: Current Valuation Implies Massive Revenue Growth
Sources: New Constructs, LLC and company filings.
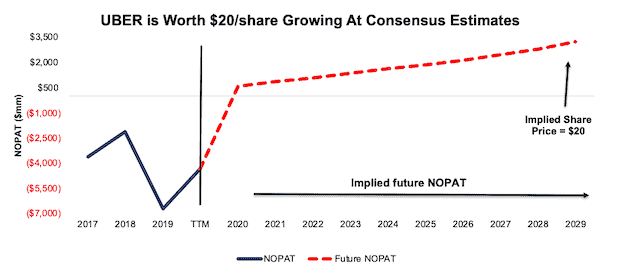
Significant Downside Even Growing at Consensus: Even if we assume Uber can achieve a 6% pre-tax margin (greater than pre-consolidation airlines) and grow revenue by 17% compounded annually (in line with longer-term consensus estimates through 2029) for the next decade, the stock is worth only $20/share today – a 63% downside to the current stock price. See the math behind this reverse DCF scenario.
Figure 4 compares the firm’s implied future net operating profit after tax (NOPAT) in this scenario to its historical NOPAT.
Figure 4: Uber Has Large Downside Risk: DCF Valuation Scenario
Sources: New Constructs, LLC and company filings.
Each of the above scenarios also assumes UBER is able to grow revenue, NOPAT, and free cash flow (FCF) without increasing working capital or fixed assets. This assumption is highly unlikely but allows us to create best-case scenarios that demonstrate how high expectations embedded in the current valuation are. For reference, UBER’s invested capital has increased by an average of $7.2 billion (51% of 2019 revenue) over the past two years.
Fiduciaries Beware: We think those with fiduciary responsibilities need to consider just how much risk they take by owning UBER at current levels given that:
- Uber’s food delivery market share is stagnant (excluding acquisitions) and rideshare is falling
- It’s path to profitability remains unclear
- The stock is priced as if Uber will improve profitability and take 167% of the ridesharing and food delivery markets in 2030.
Tesla Inc. (TSLA) – Unattractive Rating
Read the entire report here: Tesla: The Most Dangerous Stock for Fiduciaries. Read the most recent report here: Bad Idea in September, Even Worse Now.
We put Tesla in the Danger Zone on August 18, 2020 and updated the pricing data post stock-split on September 2, 2020. The stock is up 66% (S&P 500 +10%) since mid-August and ~650% year-to-date. This price appreciation is entirely disconnected from the firm’s fundamentals and its competitive position in the electric vehicle (EV) market.
Given the overvalued stock, it’s no surprise Tesla recently announced another dilutive equity issuance, led by Goldman Sachs. Just days prior, Goldman Sachs upgraded Tesla from Neutral to Buy, which raises long held questions about conflicts in Wall Street ratings.
While the stock has underperformed as a short and may continue to do so as the stock is added to the S&P 500, downside risk remains large.
Tesla Priced for Beyond Perfection: Despite losing its first mover advantage, competition ramping up production, and continued questions about the quality of its products, Tesla’s stock price continues to rise. Now the expectations baked into its stock price of ~$610/share are not only overly optimistic, but nearly impossible in some cases. To justify its current valuation Tesla must:
- Immediately achieve a 7% NOPAT margin, which is above Toyota’s 2020 NOPAT margin of 5%. For reference, Tesla’s TTM NOPAT margin is 2% and is the highest in the firm’s history.
- Grow revenue by 36% compounded annually for the next 11 years
- Grow revenue, NOPAT, and FCF without increasing working capital or fixed assets – a highly unlikely assumption that creates a truly best-case scenario. For reference, Tesla’s invested capital has grown 56% compounded annually since 2010 and 36% compounded annually over the past five years.
See the math behind this reverse DCF scenario. In this scenario, Tesla would earn $740 billion in revenue 11 years from now and the firm’s NOPAT in 2030 would equal $52 billion (vs. $538 million TTM). For comparison, the combined TTM revenue of Toyota (TM), Honda Motor Co. (HMC), Ford Motor Company (F), General Motors (GM), and Fiat Chrysler Automobiles (FCAU) is $726 billion. Toyota, the world’s second largest (by revenue) automobile manufacturer, generated TTM NOPAT of $12.8 billion, or just 25% of Tesla’s implied NOPAT in this scenario.
Its Valuation Implies Tesla Will Sell Majority of Global EVs: At its current average selling price (ASP) of ~$56k, Tesla’s current stock price implies the firm will sell 13.1 million vehicles in 2030 (up from ~431k TTM), or 50% of the expected global EV sales. If Tesla’s ASP falls to ~$38k, or the average car price in the U.S. in July 2020, its implied sales volume in 2030 increases to 19.3 million vehicles in 2030, or 74% of projected global EV sales in 2030.
We think it highly unlikely that Tesla will ever sell such a high volume of cars at its current ASP because the luxury car market is not very large relative to the overall automobile market. The fact of the matter is that there are not very many people on earth that are wealthy enough to afford such an expensive car.
So, investors should consider the implied vehicle sales by 2030 based on lower ASPs that are required to justify TSLA’s valuation at ~$610/share:
- 19.3 million vehicles – ASP of $38k (average car price in U.S. in July 2020)
- 31.2 million vehicles – ASP of $24k (equal to Toyota)
- 49.1 million vehicles – ASP of $15k (equal to General Motors)
Below are the percentages of expected global EV sales in 2030 that those numbers of vehicles represent:
- 74% for 19.3 million vehicles
- 120% for 31.2 million vehicles
- 189% for 49.1 million vehicles
In other words, even if you believe Tesla can maximize production, effectively cut costs, and introduce mass-market vehicles at an ASP equal to the U.S average, the firm must take 74% of the expected EV market to justify its current stock price. Anything less means the stock is overvalued and it must do even more to have any upside.
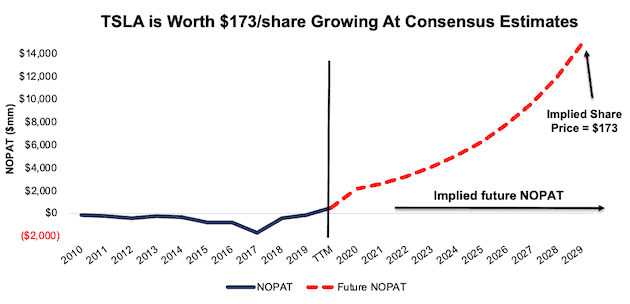
Significant Downside Even Growing at Consensus: Even if we assume Tesla can achieve a 7% NOPAT margin, above Toyota, and grow revenue by 24% compounded annually (in line with consensus estimates through 2025) for the next decade, the stock is worth only $173/share today – a 71% downside to the current stock price. See the math behind this reverse DCF scenario.
Figure 5 compares the firm’s implied future NOPAT in this scenario to its historical NOPAT. This scenario implies Tesla’s NOPAT 10 years from now will be nearly $15 billion, or 16% higher than Toyota’s TTM NOPAT.
Figure 5: Tesla Has Large Downside Risk: DCF Valuation Scenario
Sources: New Constructs, LLC and company filings.
Fiduciaries Beware: Given above,we think those with fiduciary responsibilities need to consider just how much risk they take by owning TSLA at current levels given that:
- Tesla is losing market share in Europe
- It’s first mover advantage is gone across the globe
- Incumbents are rapidly expanding production of EVs
- Tesla’s battery advantages are fading
- It’s self-driving features are consistently ranked below competitors’
- The stock is priced to take anywhere from 50% to 189% of the EV market, depending upon ASP.
DoorDash (DASH) – Unattractive Rating
Read the entire report here: DoorDash’s New Valuation Is Even More Ridiculous
We put DoorDash in the Danger Zone on November 23, 2002, prior to its IPO on December 9, 2020. After raising its IPO price range, pricing above the range, and then opening up 78% higher than its IPO price, DoorDash cemented its place as the most ridiculous IPO of the year. The abundance of interest in a money-losing firm with low barriers to entry and no path to profitability perfectly encapsulates today’s market, where momentum and narrative matter more than fundamentals and valuation.
We still believe DoorDash holds no value, $0, and its IPO served only to bail out private investors before unsuspecting public investors realize the business is not viable in its current form. The expectations baked into the new valuation are huge, and the downside risk in owing shares is even bigger.
Valuation Implies DoorDash Captures 129% of Global Food Delivery Spend: When we use our reverse DCF to analyze the expectations implied by DoorDash’s stock price, we see just how overvalued shares are. DoorDash’s stock price implies huge improvement in both market share and profit margins, two metrics that rarely improve simultaneously in competitive markets.
To justify its current price of ~$175/share, DoorDash must:
- Immediately improve its NOPAT margin to 8% compared to -67% in 2019 and an estimated -12% over the trailing-twelve months
- 8% NOPAT margin is equal to United Parcel Service’s (UPS) 2019 and TTM NOPAT margin
- Grow revenue by 45% compounded annually for the next 11 years.
See the math behind this reverse DCF scenario. In this scenario, DoorDash would earn nearly $55 billion in revenue in 2030. At its TTM take rate, this scenario equates to ~$471 billion in marketplace gross order volume for DoorDash in 2030. Take rate measures the percentage of marketplace gross order volume (GOV) DoorDash captures as revenue.
For reference, UBS estimates the global food delivery market will be worth $365 billion in 2030, and the average NOPAT margin of DoorDash’s peers (listed in original report) is -5%.
In other words, to justify DoorDash’s current price of $175/share, the firm must capture over 129% of the projected 2030 global food delivery spend, compared to ~16% TTM. See Figure 6.
Importantly and even more challenging, DoorDash must capture greater than 100% of the market while also improving margins from -12% to 8%, well above peers’ average.
To illustrate the difficulty in maintaining market share and high margins in an industry competing on price, look no further than GrubHub. In 2017, GrubHub held ~55% of the U.S. food delivery app market (excludes restaurants that deliver their own food) and earned a NOPAT margin of 10%. As competition flooded the market, GrubHub’s market share fell to 18% in October 2020, and its TTM NOPAT margin is -5%.
Given the high level of competition in the food delivery app market, we think it is highly unlikely, if not impossible, for DoorDash to achieve anything close to the market share growth and NOPAT margin improvements baked into its share price, especially after opening at such a premium to its already overvalued IPO price range.
Figure 6: Implied Marketplace GOV Grows From 5% to 129% of Food Delivery Market
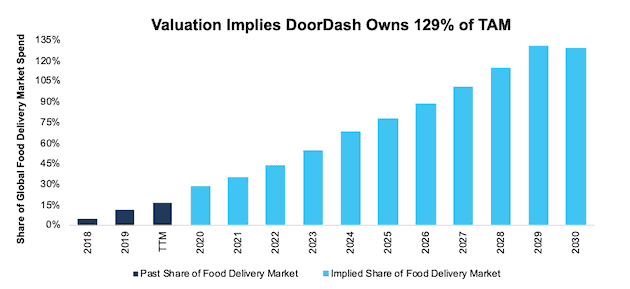
Sources: New Constructs, LLC, company filings, and UBS
Figure 7 compares the firm’s implied future NOPAT in this scenario to its historical NOPAT. In any scenario worse than this one, DASH holds significant downside risk, as we’ll show.
Figure 7: Current Valuation Implies Profits 38% Larger Than FedEx’s TTM NOPAT
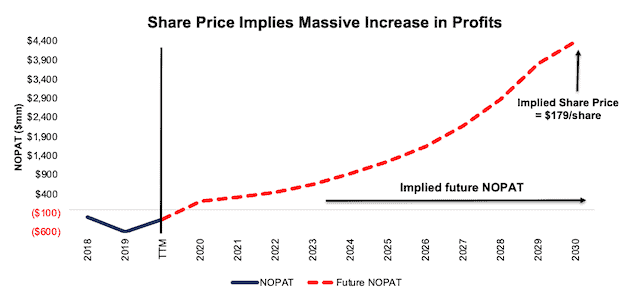
Sources: New Constructs, LLC and company filings.
Significant Downside Even if COVID-19 Permanently Changes How We Eat: Even if we assume that consumers increasingly choose food delivery as a means to eat restaurant food after COVID-19, and DoorDash’s revenue growth remains elevated for years to come, the stock holds significant downside.
If we assume DoorDash can achieve a 6% NOPAT margin (average of United Parcel Service and FedEx’s TTM NOPAT margin) and grow revenue by 30% compounded annually for the next decade, the stock is worth just $17/share today – a 91% downside to the current price. See the math behind this reverse DCF scenario.
Figure 8 compares the firm’s implied future NOPAT in this scenario to its historical NOPAT.
Figure 8: DoorDash Has Large Downside Risk: DCF Valuation Scenario
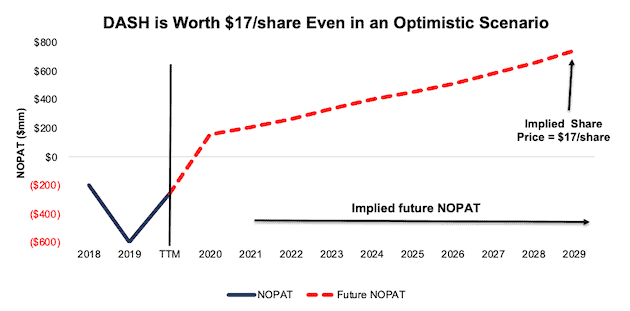
Sources: New Constructs, LLC and company filings.
Each of the above scenarios also assumes DoorDash is able to grow revenue, NOPAT, and FCF without increasing working capital or fixed assets. This assumption is highly unlikely but allows us to create best-case scenarios that demonstrate how high expectations embedded in the current valuation are. For reference, DoorDash’s invested capital increased $813 million (92% of 2019 revenue) year-over-year in 2019.
Fiduciaries Beware: Given the above,we think those with fiduciary responsibilities need to consider just how much risk they take by owning DASH at current levels given that the firm has:
- no moat
- no profits in the best-possible environment
- competition that can offer the same service for free.
Due Diligence Matters
The underperformance (as shorts) of our Most Dangerous Stocks for Fiduciaries perfectly illustrates that markets don’t always make rational decisions. Capital is allocated to firms with growing losses, no path to profit growth, or competitive disadvantages, often through the rise of passive investing.
However, for those with fiduciary responsibilities, chasing these low-quality companies with momentum-driven stock prices is not a sound strategy. Especially now, as the market reaches all-time highs, fiduciaries need to preform proper due diligence to avoid stocks where the valuations are entirely disconnected from reality, such as those listed above.
This article originally published on December 14, 2020.
Disclosure: David Trainer, Kyle Guske II, and Matt Shuler receive no compensation to write about any specific stock, sector, style, or theme.
Follow us on Twitter, Facebook, LinkedIn, and StockTwits for real-time alerts on all our research.
[1] Our Core Earnings are a superior measure of profits, as demonstrated in Core Earnings: New Data & Evidence a paper by professors at Harvard Business School (HBS) & MIT Sloan. Recently accepted by the Journal of Financial Economics, the paper proves that our data is superior to all the metrics offered by S&P Global (SPGI).