
We published an update on this Danger Zone pick on August 3, 2021. A copy of the associated Earnings Update report is here.
Global e-commerce sales have soared by 22% compounded annually over the past two years, and the COVID-19 disruptions to physical retail operations have amplified e-commerce growth. As a result, the stocks for companies that facilitate e-commerce have soared, too. One such firm’s stock is up 145% year-to-date. However, despite positive industry trends, fiduciaries should beware of the abnormally high level of risk in Shopify (SHOP: $949/share).
While Shopify’s stock performance is attractive to many momentum investors, investors with fiduciary responsibilities should take notice of how quickly high-flying tech stocks can come back down to reality and should consider the deteriorating fundamentals, increasing competition, and the unrealistic increase in profits implied by the current valuation.
This report helps investors of all types see just how extreme the risk in SHOP is based on:
- Slowing revenue growth
- Numerous, fierce, deep-pocketed competitors
- Doing the math: Shopify must facilitate five times more e-commerce sales than Amazon did in 2019 to justify the current valuation
Competition Is Heating Up
We recently highlighted Tesla (TSLA), Uber (UBER), Wayfair (W), Carvana (CVNA), and Beyond Meat (BYND) as firms that fiduciaries should avoid, in large part because each of these businesses possess very few sustainable competitive advantages. Shopify is another example of a business with limited barriers to entry that is attracting lots of competition.
Shopify aims to provide a unique, integrated e-commerce platform – not exactly an original idea. Many other firms also host online stores and process payments at competitive prices. With very little technological advantage, Shopify will have a difficult time protecting its market share from larger competitors or new entrants.
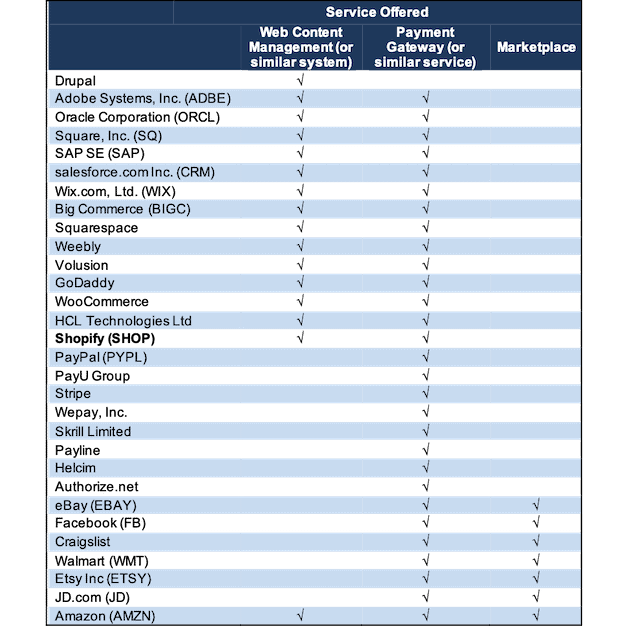
Figure 1 shows just a sample of the many firms involved in facilitating e-commerce transactions and how many provide the same services as Shopify. We classify these services as:
- Web Content Management – a system that allows users to easily create their own websites and administer website content with little programming knowledge (e.g. WordPress)
- Payment Gateway – a service that allows merchants to securely accept credit card payments
- Marketplace – an online platform to sell products and/or services from multiple third parties
We think Shopify’s operating segments, subscription solutions and merchant solutions, correlate most closely to the web content management market (projected by Prescient & Strategic Intelligence to grow at 18.4% per year) and the global payment gateway market (projected by Grand View Research to grow at 21.5% per year). Using these growth rates, the total addressable markets for these two markets are estimated to be $22.8 billion and $71.2 billion in 2027, respectively. Therefore, we estimate the TAM for Shopify to be $94 billion in 2027. This calculation plays an important role in the valuation section of this report below.
Figure 1: E-commerce Service Industry Is Filled With Competition
Sources: New Constructs, LLC
Heavy competition will not only make adding more merchants more difficult, but it also puts a limit on how much Shopify can charge for its services. Shopify has not increased the price of its monthly subscriptions on any of its three existing plans since 2017, which as we’ll show below, has been a drag on profitability. One of Shopify’s biggest competitors, WooCommerce, is keeping the pressure on by offering its e-commerce plugin for free to all WordPress users.
Despite stiff competition, Shopify has grown its top line in recent years. The gross merchandise value (GMV), or value of all sales Shopify’s merchants generate on the firm’s platform, increased from $26.3 billion in 2017 to $61.1 billion in 2019. The firm’s 2019 GMV represented 1.7% of the global e-commerce market, which was up from 1.1% in 2017.
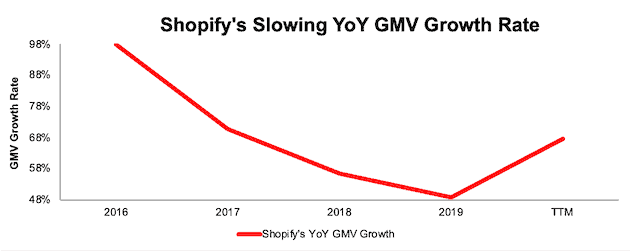
Competitive pressures have slowed Shopify’s YoY GMV growth rate, though. Per Figure 2, Shopify’s GMV growth rate declined YoY from 2017 to 2019. While the GMV growth rate is improving in the TTM, we believe this bump is temporary and related to COVID-19 temporarily boosting online sales (as we saw with Wayfair).
Figure 2: Shopify’s YoY GMV Growth Rate Since 2016
Sources: New Constructs, LLC and company filings
E-Commerce Tailwinds Aren’t Enough
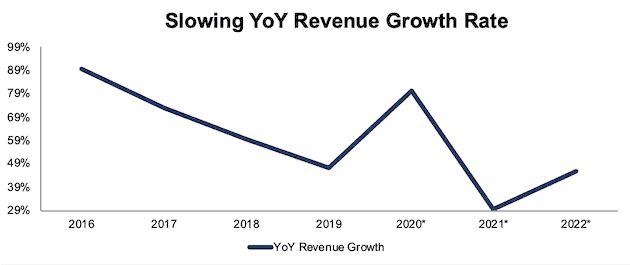
Over the long term, Shopify will find it difficult to maintain the year-over-year (YoY) growth it is experiencing in the TTM period, largely due to a secular slowdown in the overall e-commerce market. The market already expects Shopify will not sustain its current revenue growth rate. Figure 3 shows Shopify’s consensus estimate YoY revenue growth rates for 2021 and 2022 are much lower than the 2020 consensus estimate.
Figure 3: Shopify’s Revenue Growth Rate
Sources: New Constructs, LLC and company filings
*Consensus estimates
Grand View Research expects the global e-commerce market to grow by 16% compounded annually from 2020 to 2027. While this tailwind may help Shopify grow revenue over the next few years, it is not enough to produce the above-market growth rates necessary to meet the expectations baked into its current stock price, as we’ll show later.
Competition Is Much More Profitable
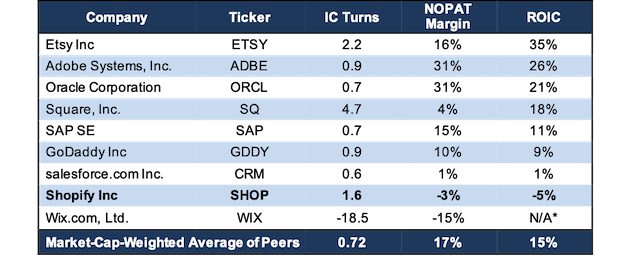
Shopify’s growth, and ultimately, its path to profitability, are hamstrung by the firm’s lagging operating efficiencies relative to competitors. While Shopify’s net operating profit after-tax (NOPAT) margin improved from -9% in 2015 to -3% TTM, it remains well below peers, per Figure 4. Peers include the following firms: Etsy Inc (ETSY), Adobe Systems, Inc. (ADBE), Oracle Corporation (ORCL), Square, Inc. (SQ), SAP SE (SAP), GoDaddy Inc (GDDY), salesforce.com Inc. (CRM), and Wix.com, Ltd. (WIX). We do not include BigCommerce (BIGC) because we do not cover it. However, with BigCommerce reporting -$5.4 million in adjusted EBITDA in 2Q20, it is safe to say that its inclusion in the peer group would only lower the group’s average NOPAT Margin and ROIC.
Shopify’s invested capital turns, a measure of balance sheet efficiency, are better than its peer group.
Nevertheless, Shopify’s superior capital efficiency is not enough to offset its negative margins. The firm has never generated positive NOPAT in any year of our model (dates back to 2015), and Shopify’s return on invested capital (ROIC) fell from -10% in 2017 to -12% in 2019. However, over the TTM, the firm’s ROIC improved to -5%, far below the firm’s peer group market-cap-weighted average ROIC of 15%.
Figure 4: Shopify’s NOPAT Margin, Invested Capital Turns, and ROIC vs. Peers
Sources: New Constructs, LLC, and company filings
*WIX earns a bottom-quintile ROIC as its NOPAT and invested capital are both negative
Shopify’s Losses Are Growing Too
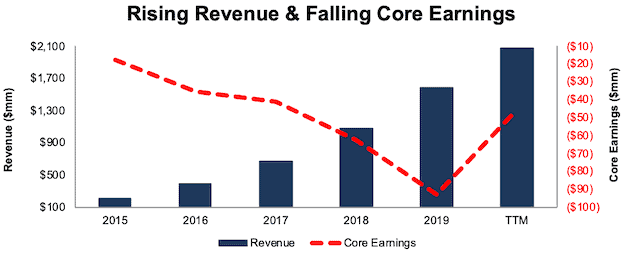
The hope for this high growth company is that it will eventually become profitable once it reaches a certain scale. Shopify does not appear to be heading in that direction, unless one believes the COVID-19 boost will be permanent. Per Figure 5, Shopify has grown revenue by 67% compounded annually since 2015. Shopify’s rapid revenue growth has come with little regard for actual profits. Shopify’s core earnings[1] have fallen from -$18 million in 2015 to -$46 million over the trailing-twelve-months (TTM).
Figure 5: Shopify’s Revenue & Core Earnings Since 2015
Sources: New Constructs, LLC, and company filings
Shopify Is Also Burning Through Cash
Shopify has a history of significant free cash flow (FCF) burn that is unlikely to change anytime soon. Since 2016, the firm has burned a cumulative $1.6 billion (1% of market cap) in FCF. What’s worse, the firm’s FCF burn is accelerating. Shopify burned $1.1 billion in FCF in the last two years combined and $759 million in the TTM period. While the firm has ample liquidity to continue operating, investors that care about fundamentals and shareholder value will not fund such a significant cash burn forever.
Doing the Math: SHOP Must Take a Large Share of Its Addressable Market
Despite the deteriorating fundamentals and tough competition, Shopify is priced as if it will achieve massive growth in revenue and profits and grow to be 50% of its total addressable market (TAM).
To justify its current price of ~$949/share, Shopify must:
- Grow revenue by 53% compounded annually (which includes 66% growth in 2020 and 51% each year thereafter – vs. consensus estimates of 66% in 2020, 30% in 2021, and 46% in 2022) for the next eight years
- Immediately achieve a 17% (equal to peer group TTM margin) NOPAT margin (compared to -3% TTM)
See the math behind this reverse DCF scenario. In this scenario, Shopify’s revenue in 2027 would be more than 29 times higher than its 2019 revenue.
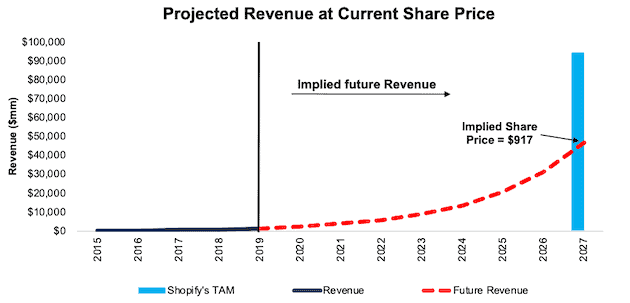
Figure 6 shows the revenue growth expectations baked into the stock price compared to the firms historical revenue. In this scenario, Shopify will grow revenue from $1.6 billion in 2019 to $46.9 billion in 2027, or 50% of Shopify’s TAM of $94 billion, as calculated above.
Figure 6: Current Valuation Implies Unrealistic Revenue Growth
Sources: New Constructs, LLC and company filings.
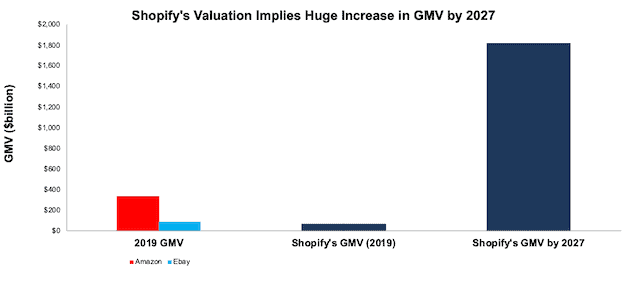
While the revenue growth implied by the stock price is 50% of the projected TAM, the implied GMV growth is even more astonishing. Last year, Shopify generated a total of $1.6 billion in revenue from a total of $61.1 billion of GMV – or $1 of revenue from every $38 of GMV. In the scenario outlined above, assuming the same revenue to GMV rate, the firm must generate $1.8 trillion in GMV in 2027 – or 29% of Grand View Research’s 2027 global B2C e-commerce market forecast of $6.2 trillion.
Per Figure 7, Shopify’s GMV in 2027 would be over 29 times the size of its 2019 GMV, 20 times larger than eBay’s 2019 GMV, and five times bigger than Amazon’s.
Figure 7: Current Valuation Implies Unrealistic GMV Growth
Sources: New Constructs, LLC and company filings.
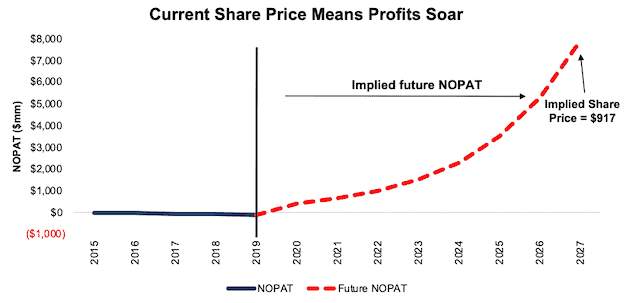
Figure 8 shows the NOPAT growth expectations baked into the stock price compared to the firms historical NOPAT. In this scenario, Shopify will grow NOPAT from -$122 million in 2019 to $8 billion in 2027. For reference, Amazon generated an average of $5.7 billion in NOPAT over the past five years and eBay averaged just $1.9 billion in NOPAT over the same time.
Figure 8: Current Valuation Implies Unrealistic NOPAT Growth
Sources: New Constructs, LLC and company filings.
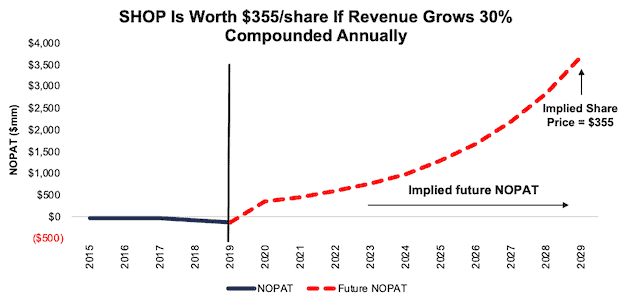
Significant Downside Even If Shopify Grows Faster Than E-commerce Market
Even if we assume Shopify can grow revenue and NOPAT at above industry average rates, SHOP still has significant downside risk. In this scenario, Shopify:
- Grows revenue by 30% compounded annually for the next decade and
- Immediately achieves a 17% (equal to peer group TTM margin) NOPAT margin
See the math behind this reverse DCF scenario. In this scenario, Shopify grows NOPAT from -$122 million in 2019 to $3.7 billion 10 years from now, and the stock is worth just $355/share today – a 63% downside. In this scenario, the firm grows revenue to $21.8 billion in 2029. If we assume, as we did in the previous scenario, that Shopify will generate ~$1 of revenue for every $38 of GMV, then the firm reaches $826.7 billion of GMV a decade from now – nearly 2.5 times Amazon’s 2019 GMV.
Figure 9 compares the firm’s implied future NOPAT in this scenario to its historical NOPAT.
Figure 9: Shopify Has Large Downside Risk: DCF Valuation Scenario
Sources: New Constructs, LLC and company filings.
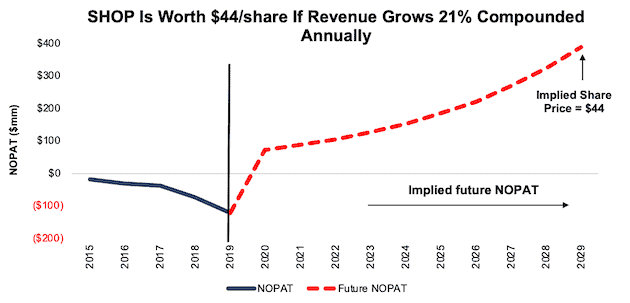
Further Downside If Shopify Grows In-Line With TAM Growth
If we assume Shopify can grow revenue at the same rate as its TAM, SHOP has much more downside risk. In this scenario, Shopify:
- Grows revenue by 21% (equal to the TAM growth rate) compounded annually for the next decade and
- Immediately achieves a 4% (equal to Square’s TTM margin) NOPAT margin
See the math behind this reverse DCF scenario. In this scenario, Shopify grows NOPAT from -$122 million in 2019 to $389 million 10 years from now, and the stock is worth just $44/share today – a 95% downside. In this scenario, the firm grows revenue to $8.5 billion in 2029. If we assume, as we did in the previous scenarios, that Shopify will generate ~$1 of revenue for every $38 of GMV, then the firm reaches $398 billion of GMV a decade from now – 19% above Amazon’s 2019 GMV of $335 million.
Figure 10 compares the firm’s implied future NOPAT in this scenario to its historical NOPAT.
Figure 10: Shopify Has an Even Larger Downside Risk With Realistic Expectations
Sources: New Constructs, LLC and company filings.
Each of the above scenarios also assumes Shopify is able to grow revenue, NOPAT and FCF without increasing working capital or fixed assets. This assumption is highly unlikely but allows us to create best-case scenarios that demonstrate how high expectations embedded in the current valuation are. For reference, Shopify’s invested capital has increased by an average of $331 million (21% of 2019 revenue) over the past four years.
Acquisition Would Be Unwise
Often the largest risk to any bear thesis is what we call “stupid money risk”, which means an acquirer comes in and pays for Shopify at the current, or higher, share price despite the stock being overvalued. While we think competitors would be off building rather than buying e-commerce capabilities, its plausible that a competitor could decide to buy Shopify. However, given the highly negative margins and overvalued stock price, we think it would be unwise for a larger firm to acquire Shopify at current levels.
The likelihood of someone acquiring Shopify is further reduced by the low barriers to entry in e-commerce. The firm does not have a substantial technological or behavioral advantage which means other firms can replicate its business model easily. Nevertheless, we think it helps to quantify what, if any, acquisition hopes are priced into the stock.
Walking Through the Acquisition Math
First, investors need to know that Shopify has large liabilities that make it more expensive than the accounting numbers would initially suggest.
- $2.3 billion in outstanding employee stock options (2% of market cap)
- $419 million in operating leases (<1% of market cap)
After adjusting for these liabilities, we can model multiple purchase price scenarios. For this analysis, we chose Alphabet, Inc. (GOOGL) as a potential acquirer of Shopify since Alphabet could create a one-stop shop offering with Shopify by integrating it with its existing domain, advertising, and search services. While we chose Alphabet, analysts can use just about any company to do the same analysis. The key variables are the weighted average cost of capital (WACC) and ROIC for assessing different hurdle rates for a deal to create value.
Even in the most optimistic of scenarios, Shopify is worth less than its current share price.
Figures 11 and 12 show what we think Alphabet should pay for Shopify to ensure it does not destroy shareholder value. There are limits on how much Alphabet should pay for Shopify to earn a proper return, given the NOPAT or free cash flows being acquired.
Each implied price is based on a ‘goal ROIC’ assuming different levels of revenue growth. In the first scenario, we use 66% revenue growth in year one, 30% in year two, and 46% in years three through five (vs. consensus estimates of 66% in 2020, 30% in 2021, and 46% in 2022). In the second scenario, the estimated revenue growth rate for years one through five is 66% (equal to 2020’s consensus estimate). We use the higher estimates in scenario two to illustrate a best-case scenario where we assume Shopify could grow revenue faster while being integrated within Alphabet’s online operations.
We conservatively assume that Alphabet can grow Shopify’s revenue and NOPAT without spending any working capital or fixed assets beyond the original purchase price. We also assume Shopify achieves an 18% NOPAT margin, which equals Alphabet’s TTM NOPAT margin. For reference, Shopify’s TTM NOPAT margin is -3%.
Figure 11: Implied Acquisition Prices for Value-Neutral Deal
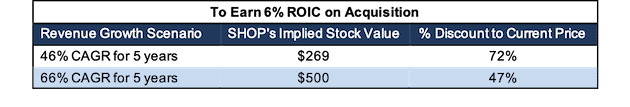
Sources: New Constructs, LLC and company filings
Figure 11 shows the implied values for SHOP assuming Alphabet wants to achieve an ROIC on the acquisition that equals its WACC of 6%. This scenario represents the minimum level of performance required not to destroy value. Even if Shopify can grow revenue by 66% compounded annually for five years and achieve an 18% NOPAT margin, the firm is worth much less than $949/share. It’s worth noting that any deal that only achieves a 6% ROIC would not be accretive, as the return on the deal would equal Alphabet’s WACC.
Figure 12: Implied Acquisition Prices to Create Value

Sources: New Constructs, LLC and company filings
Figure 12 shows the implied values for SHOP assuming Alphabet wants to achieve an ROIC on the acquisition that equals 29%, its current ROIC. Acquisitions completed at these prices would be truly accretive to Alphabet’s shareholders. Even in this best-case growth scenario, the implied value is significantly below Shopify’s current price. Without significant increases in margin or revenue growth assumed in this scenario, an acquisition of SHOP at its current price destroys significant shareholder value.
Catalyst – a Scary Market for Stocks With High Expectations
At the end of April, the consensus estimate for Shopify’s 2020 earnings was just $0.02/share. Jump forward to today, and the 2020 consensus estimate has risen all the way to $2.32/share. The 2021 consensus earnings estimate has followed a similar trend. In April, 2021 consensus earnings estimate was $0.44/share. As of September 7, 2020, the consensus earnings estimate for 2021 has increased to $2.16/share. Since May 2017, Shopify hasn’t missed earnings once. With higher expectations making a beat that much more difficult, an unusual earnings miss could send shares lower.
Further, the COVID-19 bump in sales will undoubtedly give the firm a relatively strong year of performance. Consequently, YoY comparisons in 2021 might not be so good. If sales don’t grow as fast as they did in 2020, disappointed investors might dump their shares.
SHOP has already fallen 19% since its closing price on Sep 1, 2020. A continuation of the market’s recent sell-off of tech high fliers (TSLA, W, and CVNA to name a few) could bring this stock back down to earth soon.
What Noise Traders Miss With SHOP
These days, fewer investors pay attention to fundamentals and the red flags buried in financial filings. Instead, due to the proliferation of noise traders, the focus tends toward technical trading tends while high-quality fundamental research is overlooked. Here’s a quick summary for noise traders when analyzing SHOP:
- Significant competition in all segments in which Shopify competes
- Slowing revenue growth rates
- Lack of significant and durable competitive advantages
- Long history of shareholder value destruction
- Valuation implies massive improvement in profitability with sustained revenue growth rates
Creating Value for Management, Not Shareholders
In its proxy statement, Shopify states that its executive compensation plan “aligns the interests of our executives with shareholder interests, so that we may attract, motivate and retain executives who will continue to create sustainable, long-term value for our shareholders.” While those words sound great, a closer study reveals the compensation committee is not putting its money where its mouth is.
On top of base salaries, Shopify executives receive stock options and restricted share units (RSUs) that vest at 33% per year over a three-year period. The issuance of stock options and RSUs are based on several factors such as total compensation opportunity, attraction and retention, market competitiveness, and CEO recommendations among others.
Of particular concern for shareholders is Shopify’s history of value destruction. The firm’s already negative economic earnings fell from 2015 to 2019. Over the TTM, the firm’s economic earnings have slightly improved with the COVID-19-induced bump in revenue.
Even as shareholders have experienced value destruction, management has seen its stock-based compensation soar over the same time. Per Figure 13, shareholders experienced a cumulative -$473 million in economic earnings from 2015 to 2019, while management has been rewarded with a cumulative $334 million in stock-based compensation over the same time.
Shopify should link executive compensation with improving ROIC, which is directly correlated with creating shareholder value, so shareholders’ interests are properly aligned with executives’ interests.
Figure 13: Shopify’s Economic Earnings vs. Stock-Based Compensation Since 2015
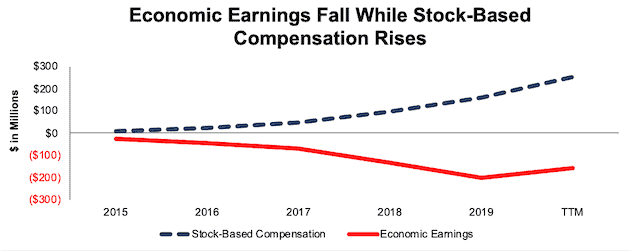
Sources: New Constructs, LLC, and company filings
Insider Trading and Short Interest
Over the past twelve months, there have been no insider transactions.
There are currently 1.7 million shares sold short, which equates to 1% of shares outstanding and less than one day to cover. The number of shares sold short has increased by 7% since last month.
Critical Details Found in Financial Filings by Our Robo-Analyst Technology
As investors focus more on fundamental research, research automation technology is needed to analyze all the critical financial details in financial filings as shown in the Harvard Business School and MIT Sloan paper, "Core Earnings: New Data and Evidence”.
Below are specifics on the adjustments we make based on Robo-Analyst findings in Shopify’s 10-Q and 10-K:
Income Statement: we made $99 million of adjustments, with a net effect of removing $2 million in non-operating expenses (<1% of revenue). You can see all the adjustments made to Shopify’s income statement here.
Balance Sheet: we made $2.7 billion of adjustments to calculate invested capital with a net decrease of $2.2 billion. One of the most notable adjustments was $327 million for midyear acquisitions. This adjustment represented 10% of reported net assets. You can see all the adjustments made to Shopify’s balance sheet here.
Valuation: we made $6.2 billion of adjustments with a net effect of increasing shareholder value by $725 million. The most notable adjustment to shareholder value was $3.5 billion in excess cash. This adjustment represents 3% of Shopify’s market cap. See all adjustments to Shopify’s valuation here.
Very Unattractive Funds That Hold SHOP
The following funds receive our Very Unattractive rating and allocate significantly to SHOP:
- Morgan Stanley Advantage Portfolio (MSPRX) – 8.6% allocation and Very Unattractive rating
- Morgan Stanley Growth Portfolio (MSEQX) – 7.3% allocation and Very Unattractive rating
- Transamerica Capital Growth (TFOIX) – 7.0% allocation and Very Unattractive rating
- Morgan Stanley Discovery Portfolio (MSKLX) – 6.7% allocation and Very Unattractive rating
- Morgan Stanley Insight Fund (MCRTX) – 6.6% allocation and Very Unattractive rating
- Virtus Zevenbergen Innovative Growth Stock Fund (SAGAX) – 6.4% and Very Unattractive rating
This article originally published on September 10, 2020.
Disclosure: David Trainer, Kyle Guske II, and Matt Shuler receive no compensation to write about any specific stock, sector, style, or theme.
Follow us on Twitter, Facebook, LinkedIn, and StockTwits for real-time alerts on all our research.
[1] Our core earnings are a superior measure of profits, as demonstrated in Core Earnings: New Data & Evidence a paper by professors at Harvard Business School (HBS) & MIT Sloan. The paper empirically shows that our data is superior to “Operating Income After Depreciation” and “Income Before Special Items” from Compustat, owned by S&P Global (SPGI).