We’ve long argued (and proven empirically) that there is a strong correlation between improving return on invested capital (ROIC)[1] and increasing shareholder value. Nevertheless, the majority of mutual fund managers continue to pick stocks using accounting-based metrics such as price-to-earnings ratios, return on equity, or accounting book value.
We analyze[2] these metrics for all the holdings of over 7,500 U.S. ETFs and mutual funds daily to identify which fund managers put their analytical money where their mouth is. Occasionally, we come across a fund whose managers look beyond accounting earnings in their investment strategy.
This week we are featuring one such fund, the Deutsche DWS Cash Return on Capital Invested (CROCI) U.S. Fund (DCURX and other share classes), as this week’s Long Idea.
Backwards Looking Research Underrates this Fund
Deutsche DWS CROCI U.S. Fund has underperformed its benchmark, the iShares Russell 1000 Value ETF (IWD), since its inception in 2015. As a result, the fund has its 2-Star and 3-Star ratings (depending upon share class) from Morningstar.
However, past performance has little predictive value for future results. Research from Morningstar itself recently showed that there’s almost no difference in the long-term returns of 3-star vs. 5-star funds.
Instead of looking at past performance, we analyze funds based on their holdings. When viewed through our Predictive Risk/Reward Fund Rating methodology, all share classes earn a Very Attractive rating. Higher quality holdings and below average costs mean DCURX is more likely to outperform moving forward, which is something traditional fund research can’t tell you.
Figure 1: Deutsche DWS CROCI U.S. Fund Ratings

Sources: New Constructs, LLC and company filings
Holdings Research Reveals Stock Methodology Based on Economic Value
DCURX’s managers use an investment philosophy that recognizes the flawed nature of accounting earnings. From the fund’s summary prospectus:
The CROCI Investment Process is based on the belief that the data used in traditional valuations (i.e., accounting data) does not accurately appraise assets, reflect all liabilities or represent the real value of a company. This is because the accounting rules are not always designed specifically for investors and often utilize widely differing standards which can make measuring the real asset value of companies difficult.
Furthermore, the company uses the “CROCI economic price to earnings ratio” to value firms. According to management, the economic P/E ratio incorporates all of the assets and liabilities of a company, and is calculated as economic price-to-book (enterprise value/invested capital, which is a cleaner version of price-to-book) divided by CROCI. From the firm’s prospectus, this ratio “seeks to measure the “real” economic value rather than the “accounting” value of a company’s invested capital, and the economic returns thereof.”
This investment process, along with a focus that, as the fund states, “contrasts with more conventional definitions of “Value” that tend to be based on accounting measures such as equity or profits”, helps management pick higher quality stocks and avoid riskier stocks compared to its peers. Figure 2 shows that DCURX allocates a significantly higher percentage of its assets to Attractive-or-better rated stocks and a significantly lower percentage to Unattractive-or-worse rated stocks than its benchmark, the iShares Russell 1000 Value ETF (IWD).
Figure 2: DCURX Asset Allocation Compared to IWD

Sources: New Constructs, LLC and company filings
Per Figure 2, DCURX allocates 59% of its assets to Attractive-or-better rated stocks compared to just 23% for IWD. On the flip side, DCURX allocates 8% of its assets to Unattractive-or-worse rated stocks compared to 41% for IWD.
Given this favorable allocation relative to the benchmark, Deutsche DWS CROCI U.S. appears well positioned to capture more upside with lower risk. Compared to the average mutual fund, DCURX has a much better chance of generating the outperformance required to justify its fees.
Superior Stock Selection Drives Superior Risk/Reward
With a focus on economic value and cash return on capital invested, one would expect DCURX’s managers to excel at finding higher-quality companies (as measured by ROIC) with lower-risk valuation. Per Figure 3, they do just that.
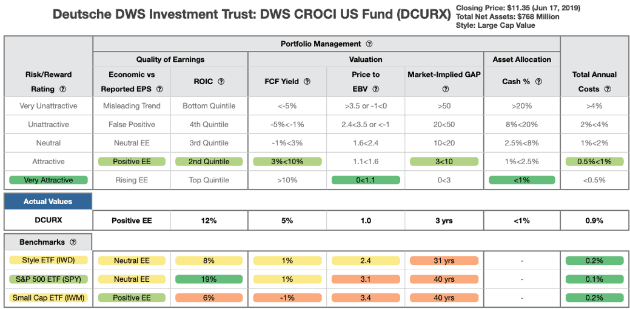
Figure 3 contains our detailed rating for DCURX, which includes each of the criteria we use to rate all funds under coverage. These criteria are the same for our Stock Rating Methodology, because the performance of a fund’s holdings equals the performance of a fund after fees.
Figure 3: Deutsche DWS CROCI U.S. Fund Rating Breakdown

Sources: New Constructs, LLC and company filings
As Figure 3 shows, DCURX’s holdings are superior to IWD in all five of the criteria that make up our holdings analysis:
- DCURX’s return on invested capital (ROIC) is 12%, which is greater than the 8% earned by IWD.
- DCURX’s free cash flow yield of 5% is five times that of IWD and the S&P 500 (SPY) at 1%.
- The price to economic book value (PEBV) ratio for DCURX is 1.0, which is less than the 2.4 for IWD holdings and the 3.1 of SPY holdings.
- Our discounted cash flow analysis reveals an average market implied growth appreciation period (GAP) of just three years for DCURX holdings compared to 31years for IWD and 40 years for SPY.
Ultimately, the stocks held by DCURX generate superior cash flows compared to IWD, yet the market expects stocks held by IWD to grow profits by more than double that of DCURX stocks.
Below Average Costs Benefit Investors
Not only does DCURX offer high-quality stock selection, it does so at a reasonable price. The fund’s total annual costs of 0.88% make it cheaper than 77% of the 885 Large Cap Value mutual funds that we cover. Its costs are also below the Large Cap Value mutual fund average of 1.65% and the asset-weighted average of 1.28%. Other share classes, such as DCUAX, DCUUX, and DCUCX have above-average total annual costs. However, these share classes justify higher fees through superior holdings.
Deep Dive on a Quality Holding
We can see how DCURX’s methodology leads it to pick high-quality stocks by looking at one of its holdings, Discover Financial Services (DFS: $77/share).
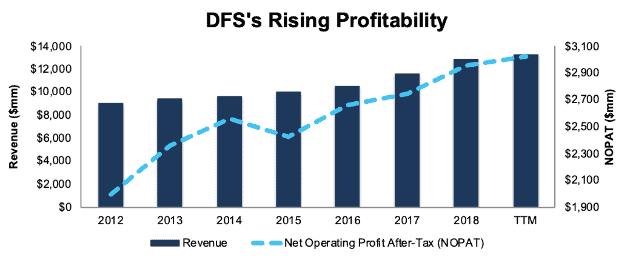
DFS meets the criteria that drive DCURX’s investment decisions – positive economic earnings and an undervalued stock price. Its 21% ROIC (up from 11% in 2011) puts it in the top quintile of all 2,800+ companies under our coverage. Since 2012, it has grown after-tax profit (NOPAT) by 7% compounded annually and generated $13 billion (52% of market cap) in free cash flow. TTM NOPAT is also up 7% over the prior TTM period.
Figure 4: DFS’ Revenue & Profit Growth Since 2012

Sources: New Constructs, LLC and company filings
At its current price of $77/share, DFS has a price-to-economic book value (PEBV) ratio of 0.7. This ratio means the market expects DFS’ NOPAT to permanently decline by 30%. This expectation seems overly pessimistic for a firm that has grown NOPAT by 5% compounded annually over the past five years and 7% compounded annually since 2012.
If DFS can maintain TTM NOPAT margins of 23% and grow NOPAT by just 3% compounded annually for the next decade, the stock is worth $115/share today – a 49% upside. See the math behind this dynamic DCF scenario here.
By utilizing economic earnings to value firms (rather than accounting earnings) as part of its methodology, DCURX is able to identify highly profitable companies trading at large discounts to their fair value, such as DFS.
DCURX’s Methodology Isn’t Perfect
Despite its ability to find quality, undervalued stocks, DCURX’s methodology is not perfect. It results in managers picking low-quality stocks (not many, per Figure 1), such as Exelon Corporation (EXC: $50/share). EXC’s fundamentals are headed in the wrong direction.
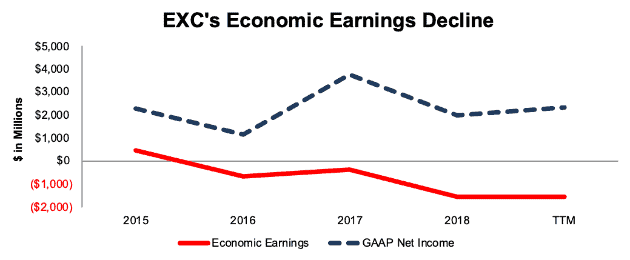
Per Figure 5, EXC’s economic earnings, the true cash flows of the business, have declined from $475 million in 2015 to -$1.6 billion over the trailing twelve months (TTM). GAAP net income has risen from $2.26 billion to $2.33 billion over the same time.
EXC’s invested capital has grown at double the rate of NOPAT since 2015, which explains the fundamental deterioration noted above. The company’s total debt, which includes off-balance sheet operating leases, has increased from $28 billion in 2015 to $38.6 billion TTM.
Figure 5: EXC’s Economic Earnings Reveal Growing Losses

Sources: New Constructs, LLC and company filings
Given the deteriorating fundamentals above, and our analysis of the expectations baked into its stock price, EXC appears to be a low-quality company and overvalued stock – not a winning combination.
To justify its current price of $50/share, EXC must maintain 2018 NOPAT margins (10%) and grow NOPAT by 3% compounded annually for the next 10 years. See the math behind this dynamic DCF scenario. This expectation might not seem unrealistic, until one considers that EXC has grown NOPAT by less than 1% compounded annually over the past decade while margins have fallen from 18% to 10%. This scenario implies the exact opposite, maintain margins and triple historical NOPAT growth.
If EXC traded at its economic book value, or no-growth value of the stock, it would be worth $29/share today – a 42% downside.
Luckily for investors, EXC appears to be an outlier in what is largely a strong portfolio.
The Importance of Holdings Based Fund Analysis
Smart fund (or ETF) investing means analyzing the holdings of each mutual fund. Failure to do so is a failure to perform proper due diligence. Simply buying a mutual fund or ETF based on past performance does not necessarily lead to outperformance. Only through holdings-based analysis can one determine if a fund’s managers are sticking to their stated methodology and are allocating to high-quality stocks, as DCURX does.
However, most investors don’t realize they can already get the sophisticated fundamental research that Wall Street insiders use. Our Robo-Analyst technology analyzes the holdings of all 951 ETFs and mutual funds in the Large Cap Value style and 7,500+ ETFs and mutual funds under coverage to avoid “the danger within.” The number of holdings in these Large Cap Value ETFs and mutual funds varies from just 14 stocks to 1182 stocks in a given fund. Our diligence on holdings allows us to cut through the noise and find mutual funds, like DCURX, with a portfolio and methodology that suggests future performance will be strong.
This article originally published on June 19, 2019.
Disclosure: David Trainer, Kyle Guske II, and Sam McBride receive no compensation to write about any specific stock, style, or theme.
Follow us on Twitter, Facebook, LinkedIn, and StockTwits for real-time alerts on all our research.
[1] This paper compares our analytics on a mega cap company to other major providers. The Appendix details exactly how we stack up.
[2] Harvard Business School features our Robo-Analyst research automation technology in the case New Constructs: Disrupting Fundamental Analysis with Robo-Analysts.
