We closed this position on October 11, 2017. A copy of the associated Position Update report is here.
A market leader is not often priced for permanent profit decline amidst improving market conditions. Throw in rising profits, an executive compensation plan aligned with creating shareholder value, and regulatory tailwinds, and this stock could be the next hidden gem. Tenneco Inc. (TEN: $63/share) is this week’s Long Idea and on April’s Most Attractive Stocks list.
Tenneco’s Impressive Profit Growth
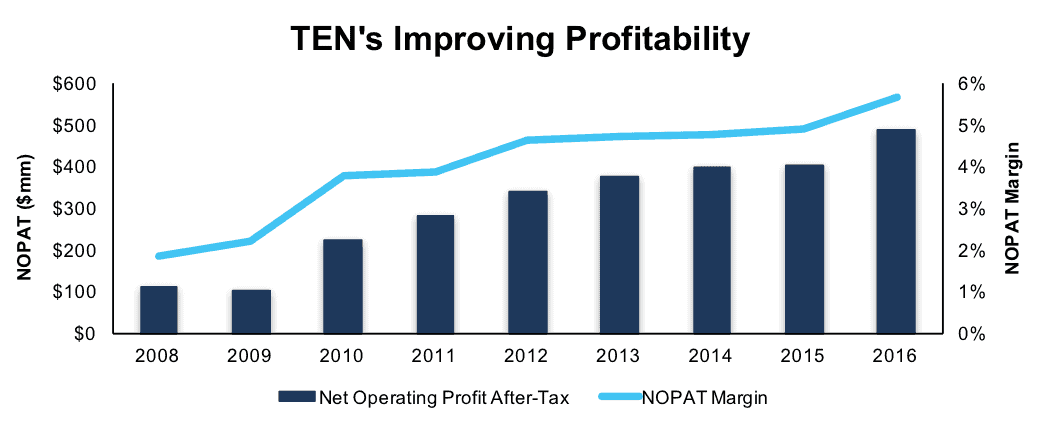
Since 2008, Tenneco has grown after-tax profit (NOPAT) by 20% compounded annually to $488 million in 2016. The company has grown revenue by 5% compounded annually over the same time. Per Figure 1, the company’s NOPAT margin has improved from 2% in 2008 to nearly 6% in 2016. Longer-term, Tenneco has grown NOPAT by 13% compounded annually since 2000.
Figure 1: TEN Profit Growth Since 2008
Sources: New Constructs, LLC and company filings
In addition to NOPAT growth, Tenneco has generated a cumulative $1.1 billion (33% of market cap) in free cash flow (FCF) over the past five years. Tenneco has also exhibited good stewardship of capital amidst multiple economic cycles. The company has earned a positive return on invested capital (ROIC) every year since 1998 and currently earns a 14% ROIC, which is in the second quintile of our coverage universe.
Executive Compensation Plan Is Aligned with Improving ROIC
TEN’s executive compensation plan includes base salary, annual bonuses, and long-term stock-based compensation. 75% of annual cash incentives are tied to improvements in Economic Value Added (EVA), aka economic earnings. EVA has been a target metric in Tenneco’s executive compensation plan since at least 1997, which is the earliest available electronic filing. Tenneco’s compensation committee uses EVA because “EVA improvement performance is correlated with stockholder returns and that making business and investment decisions based on EVA balances cash-oriented and earnings-oriented results.”
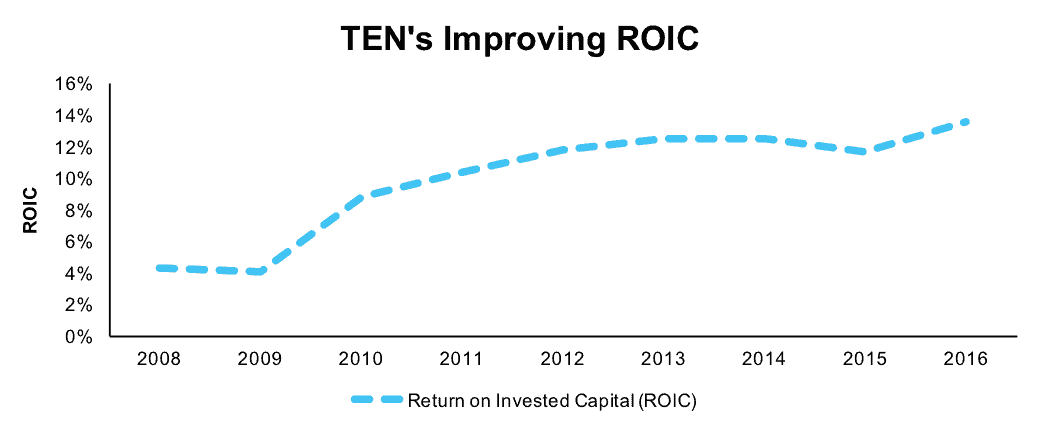
The focus on EVA helps ensure executives continue to be good stewards of capital. Per Figure 2, TEN’s ROIC has improved from 4% in 2008 to its current 14%. More importantly, TEN has grown economic earnings from -$15 million in 2008 to $227 million in 2016.
Figure 2: Tenneco’s Rising ROIC Showcases Proper Executive Incentives
Sources: New Constructs, LLC and company filings
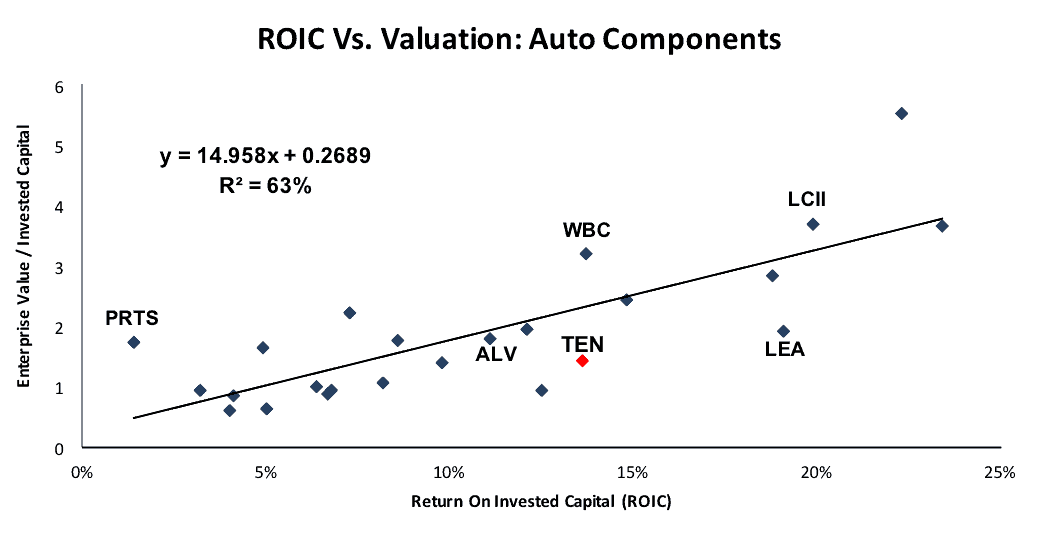
We know from Figure 3 below, and numerous case studies, that ROIC is directly correlated to changes in shareholder value. ROIC is, by far, the most important driver of EVA. Accordingly, TEN’s use of EVA to measure performance ensures executives’ interests are aligned with shareholders’ interests.
Improving ROIC Correlated with Creating Shareholder Value
Per Figure 3, ROIC explains 63% of the changes in valuation for the 24 Auto Components firms we cover. Despite TEN’s 14% ROIC, above the 11% average of the peer group, the firm’s stock trades at a discount to peers as shown by its position below the trend line in Figure 3. If the stock were to trade at parity with its peers, it would be at $122/share – 96% above the current stock price. Given the firm’s higher ROIC and impressive profit growth, one would think the stock would garner a premium valuation.
Figure 3: ROIC Explains 63% Of Valuation for Auto Components Firms
Sources: New Constructs, LLC and company filings
TEN’s Profitability Helps Maintain Market Leading Position
The automotive component industry is highly fragmented, with many firms manufacturing one specific piece of the entire automobile puzzle. In the clean air and ride performance subsets, Tenneco faces competition from foreign firms such as Faurecia and Hitachi Automotive Systems. The firm also faces competition from vehicle parts manufacturers such as BorgWarner (BWA), Dana Incorporated (DAN), and U.S. Auto Parts Network (PRTS). Per Figure 4, TEN has the highest ROIC and one of the highest NOPAT margins versus peers.
High margins have allowed TEN to build a market leading position across the globe. The company estimates it holds the top market position in its ride performance segment and is one of the top two suppliers of clean air products worldwide. TEN’s profitability gives it the flexibility to invest in research and development to build new technologies such as active suspension systems while maintaining profitability. Most importantly, TEN is able to competitively price its products to maintain or take market share without compromising profitability.
Figure 4: TEN’s Profitability Among Peers

Bear Concerns Assume Emission Regulations Cease to Exist
As a manufacturer of clean air and ride performance products, such as exhaust systems and suspension products, TEN is reliant on a strong auto market. Bears will argue that auto sales are peaking and that Tenneco’s impressive profit growth cannot continue. However, automotive regulations, particularly emissions and safety standards, provide a clear demand for Tenneco’s products for many years to come. Add in expected investments to improve margins and prudent cost management, and the bear case has some large holes.
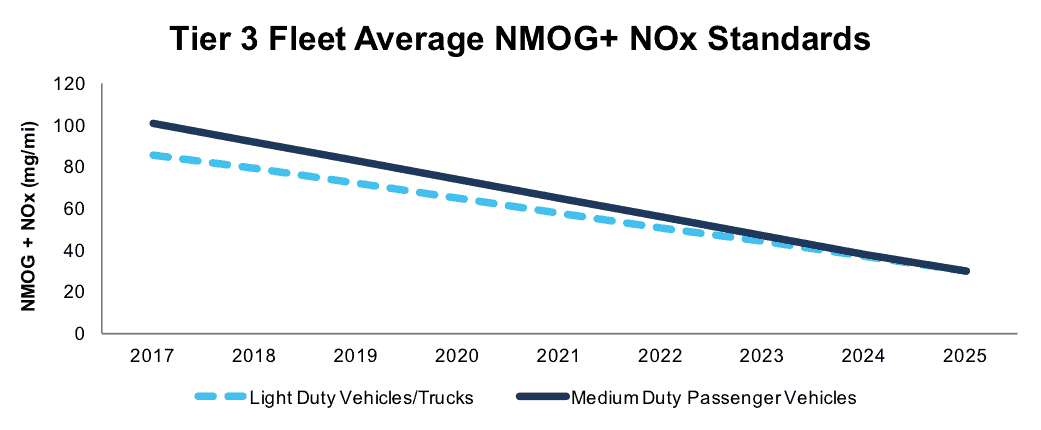
Each country sets emission standards for different vehicle types. More stringent requirements create the need for advanced technology that can more effectively limit emissions from combustion engines. In the United States, where Tenneco generates 50% of total revenues, the current emission regulations call for a steady reduction in non-methane organic gas plus oxides of nitrogen (NMOG+NOx) from 2017-2025, per Figure 5. These standards must be met, on average, across each manufacturer’s fleet of all vehicles.
One of the largest concerns regarding emissions standards in the United States is whether President Trump will roll back these regulations or stop any further increases in standards. Rolling back current regulations would be tough since they are locked in through 2021 and will be re-evaluated for 2022-2025. To change the existing standards, the Department of Transportation would have to rewrite average fuel economy standards and the EPA would have to re-write greenhouse gas emissions laws. Any changes by the EPA must go through the formal rulemaking process, complete with public comment periods and agency analysis. Those changes could be challenged in court just like some of President Trump’s current executive orders.
By 2022, when U.S. standards could be relaxed, automakers will have made significant investment in manufacturing processes to support emission improvements and rolling back would be more expensive than maintaining.
Meanwhile, across the globe even higher standards are becoming the norm. In China, new emission regulations are being phased in from 2013-2023. By 2023, CO levels must be below 0.5g/km, down from 1.0g/km in 2018. Across the European Union, new real driving emissions standards will be applied between 2016-2022. Over this time, the standards require a 90% reduction in particulates per kilometer and 95 grams of carbon dioxide per kilometer, down from 130g/km in 2015. Lastly, in India, new regulations are being rolled out from 2010-2020. The Bharat Stage 6 regulations, have been expedited to 2020, ahead of the original implementation date of 2024.
Both the Chinese and Indian standards are based on European Union 6 (Euro 6) standards, and in some cases, are more strict for certain specific pollutant levels. The Euro 6 standards, rolling out through 2022, require no more than 95 g/km in carbon dioxide (CO2) pollutants. Under the current U.S. regulations, U.S. standards will require no more than 101 g/km in CO2 pollutants in 2025.
Despite the increases in the U.S., global standards will be higher. As long as the U.S. gets to operate with lower standards, we think there is little likelihood for President Trump to try to slow or reverse rising standards.
Figure 5: More Stringent US Emissions Standards Are Expected
Sources: New Constructs, LLC
Apart from regulatory trends, Tenneco’s largest customers, General Motors (GM) and Ford (F), which accounted for 17% and 13% of 2016 revenue respectively, have reported positive sales trends to begin the year. Just this year, Ford has reported its best January truck sales since 2004, the second-best February retail sales in 11 years, and Super Duty sales up 26% year over year in March. General Motors on the other hand noted that multiple Chevrolet models had their best-ever January retail sales, its total sales grew 4% in February, and retail sales grew 5% in March, faster than any other full-line automaker.
Tenneco has also been internally focused on improving profitability, and effective cost management could lead to increased margins. Over the past five years, the company has managed to limit growth in cost of sales and research and development to 3% compounded annually. Meanwhile, revenue has grown 4% compounded annually over the same time. Effective cost management moving forward will allow TEN to take advantage of the improving market and capitalize on regulatory requirements.
Lastly, TEN’s low valuation also undermines many bear arguments. Despite improving profitability, and promising regulatory trends, TEN’s current valuation implies a permanent decline in profits, as we’ll show below.
Tenneco’s Cheap Valuation Implies Significant Cut in Profits
Year-to-date, TEN is up 2% while the S&P is up nearly 7%. This underperformance comes despite improving fundamentals and presents a buying opportunity in an undervalued stock. At its current price of $63/share, TEN has a price-to-economic book value (PEBV) ratio of 0.7. This ratio means the market expects Tenneco’s NOPAT to permanently decline by 30%. This expectation seems at odds with a firm that has grown NOPAT by 13% compounded annually since 2000.
Even if TEN were to never again grow profits from current levels, the economic book value, or no growth value of the firm is $87/share – a 38% upside from the current valuation.
However, if TEN can maintain 2016 NOPAT margins (6%) and grow NOPAT by just 4% compounded annually for the next decade, the stock is worth $110/share today – a 75% upside. This scenario assumes TEN can grow revenue by consensus estimates in 2017 (3%) and 2018 (4%), and 4% each year thereafter. With stricter carbon emission regulations and new plants providing improved margins, TEN could easily meet or surpass these expectations. Add in the potential yield detailed below and its clear why TEN is on this month’s Most Attractive Stocks List and could be an excellent portfolio addition.
Buy Backs Plus Dividend Could Yield Nearly 7%
In 2016, TEN repurchased $225 million worth of stock, up from nearly $213 million in 2015. In February 2017, the company authorized $400 million in repurchases over the next three years. Going forward, if TEN were to average its 2015 and 2016 repurchase activity, the firm’s existing authorization would last just under two years, and the firm would repurchase $219 million this year. A repurchase of this size is 6.4% of the current market cap. When combined, Tenneco’s 6.4% repurchase yield and 0.4% dividend yield offer investors a total potential yield of 6.8%.
Overseas Investment Could Set Up Earnings Beat
IHS Markit, information and analytics provider, expects light vehicle production to grow 2% compounded annually through 2030. In order to grow revenue and profits above industry projections (management’s stated goal is to grow 3-5% above industry production), TEN must look to the fastest growing markets, China and India. By 2030, the Asia Pacific region is expected to represent 70% of global unit growth and 53% of the entire light vehicle market.
To succeed in these markets (where many companies have failed), TEN is investing in four new plants in China and one in Eastern Europe. These investments ensure TEN can meet demand in these growing markets while simultaneously maintaining margins as it grows its global footprint. In the shorter-term, management expects to leverage its current operational capabilities to deliver full year margin improvement in 2017.
With improving margins and revenue, beating both top and bottom line expectations could prove an effective catalyst. When TEN reported 1Q16 results above consensus, the stock rose 14% the following day. In 4Q15, when TEN again beat bottom line expectations, the stock rose 26% in the following week.
With positive regulatory restrictions outside the United States, strict emissions through 2021 in the U.S. (and an uphill battle to overturn them post 2021), and expansion into high growth markets, TEN could be poised for another beat and subsequent increase in valuation. In the meantime, investors in this stock carry very low valuation risk and are rewarded with a potential 7% total yield given TEN’s history of dividends and share repurchases.
Insider Trends and Short Interest Are Minimal
Over the past 12 months, there have been 330 thousand insider shares purchased and 971 thousand insider shares sold for a net effect of 641 thousand insider shares sold. These sales represent 1% of shares outstanding. Additionally, short interest sits at 2 million shares, or 4% of shares outstanding.
Impact of Footnotes Adjustments and Forensic Accounting
Our Robo-Analyst technology enables us to perform forensic accounting with scale and provide the research needed to fulfill fiduciary duties. In order to derive the true recurring cash flows, an accurate invested capital, and an accurate shareholder value, we made the following adjustments to Tenneco’s 2016 10-K:
Income Statement: we made $558 million of adjustments, with a net effect of removing $125 million in non-operating expense (1% of revenue). We removed $216 million in non-operating income and $342 million in non-operating expenses. You can see all the adjustments made to TEN’s income statement here.
Balance Sheet: we made $1.9 billion of adjustments to calculate invested capital with a net increase of $1.2 billion. The largest adjustment was $665 million due to other comprehensive income. This adjustment represented 28% of reported net assets. You can see all the adjustments made to TEN’s balance sheet here.
Valuation: we made $1.9 billion of adjustments with a net effect of decreasing shareholder value by $1.9 billion. There were no adjustments that increased shareholder value. Apart from total debt, which includes $109 million in operating leases noted above, one of the most notable adjustments was $292 million in underfunded pensions. This adjustment represents 9% of TEN’s market cap. Despite the net decrease in shareholder value, TEN remains undervalued.
Attractive Funds That Hold TEN
The following funds receive our Attractive-or-better rating and allocate significantly to TEN.
- ValueShares U.S. Quantitative Value (QVAL) – 2.5% allocation and Very Attractive rating.
This article originally published on May 1, 2017.
Disclosure: David Trainer and Kyle Guske II receive no compensation to write about any specific stock, style, or theme.
Follow us on Twitter, Facebook, LinkedIn, and StockTwits for real-time alerts on all our research.
Click here to download a PDF of this report.
Photo Credit: CheapFullCoverageAutoInsurance.com (Flickr)


2 replies to "Undervalued Parts Manufacturer With A 7% Yield"
I get your emails and am a member but is won;t let me log in. I can log in on Scottrade but not through your emails.
I second that. Thank Louis. It is frustrating not to be able to access the information.