We published an update on JNJ on April 27, 2022. A copy of the associated Earnings Update report is here.
We published an update on ALSN on February 23, 2022. A copy of the associated Earnings Update report is here.
Just as we did last year we’re starting 2021 by looking at the Long Ideas that performed poorly in 2020. Next week, we’ll review our best performers.
Allison Transmission Holdings Inc (ALSN: $42/share), Korn Ferry (KFY: $43/share), and Johnson & Johnson (JNJ: $158/share) are the Long Idea lowlights for 2020. Despite their underperformance, we remain bullish on these stocks, and they all remain open Long Ideas.
Long Ideas Outperformed in 2020
Figure 1 shows that the average return of Long Ideas outperformed the S&P 500 from the date of publication through December 31, 2020 by 5.7%. Not only did these ideas outperform as a long portfolio, only five had negative returns.
Our Long Ideas combine our proprietary fundamental data, proven superior in a paper forthcoming in The Journal of Financial Economics[1], with qualitative research to highlight firms whose stocks present excellent risk/reward. Long Ideas show investors how to use our research and display the transparency of our analytical processes.
Figure 1: Long Idea Performance: From Date of Publication Through 12/31/2020

Sources: New Constructs, LLC
Lowlight 1: Allison Transmission Holdings Inc (ALSN) – 2020 Performance: Down 11% vs. S&P 500 up 16%: Since Report Publication on June 15: Up 12% vs. S&P 500 up 21%
Allison Transmission was one of the firms featured in our “See Through the Dip” series of reports, where we make the case for a return to pre-pandemic profitability once COVID-19 is in the rear view mirror. Though the stock has rallied from lows of $27/share in late March 2020, the stock still offers plenty of upside in the recovery.
Reason for Underperformance: Pandemic-Related Problems Temporarily Lowered Allison’s Profitability: Overall weakness in the economy and customer shutdowns drove Allison’s revenue from $2.7 billion in 2019 to $2.2 billion over the trailing-twelve months (TTM). The firm’s return on invested capital (ROIC) has also fallen from 17% to 10% over the same time.
Thesis: Strong Market Position and an Economic Recovery Will Help Improve Profitability: The deterioration of the firm’s fundamentals was expected given a slowdown in capital expenditures across the globe and represents the anticipated “dip” within our thesis. However, we believe these pandemic-related challenges are temporary, and a rebounding economy, along with fully operating customers, will drive the firm’s revenue and profitability higher.
More specifically, with over 60% of the market share of automatic transmissions for medium- and heavy-duty commercial vehicles, Allison is well-positioned to benefit from industry tailwinds. The heavy-duty commercial vehicle market is expected to grow by 5% compounded annually from 2020 to 2025. While the stock has underperformed, we remain bullish on the long-term outlook for the company and the stock.
Current Price Leaves Lots of Upside: We use our reverse discounted cash flow (DCF) model to analyze the implied value of the stock based on assumptions about Allison’s future growth in cash flows.
In this scenario, we assume:
- Allison maintains its TTM NOPAT margin of 19% (vs. 24% in 2019)
- Revenue falls 3% compounded annually from 2020 to 2022 (in line with consensus estimates)
- Revenue grows at 3.5% thereafter, which is the average global GDP growth rate since 1961
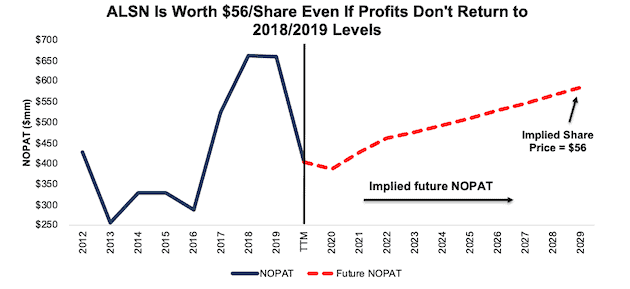
In this scenario, Allison’s non-operating profit after tax (NOPAT) falls by 1% compounded annually over the next decade (including a 41% drop in 2020) and the stock is worth $56/share today – a 25% upside to the current price. See the math behind this reverse DCF scenario. Such a scenario could prove conservative given that in the five years prior to the pandemic, Allison grew revenue and NOPAT by 5% and 15% compounded annually, respectively.
Figure 2: Allison Transmission’s Historical and Implied NOPAT

Sources: New Constructs, LLC and company filings
Lowlight 2: Korn Ferry (KFY) – 2020 Performance: Up 4% vs. S&P 500 up 16%: Since Report Publication on February 5: Down 1% vs. S&P 500 up 11%
While we did not anticipate the large economic impact of the pandemic at the time, KFY proved to be resilient even in a volatile 2020. The stock fell 48% over the roughly two-month period following our report in February. Since its March lows, the stock rallied 97% and finished the year with a modest 4% gain.
Reason for Underperformance: Economic Downturn Hurt Organizational Consulting: The decline in economic activity heavily impacted this cyclical consulting business. Fiscal 1Q21 saw a year-over-year (YoY) revenue decline of 30%. The firm’s profitability also sharply declined as ROIC fell from 12% in fiscal 2020 to just 7% TTM. However, fiscal 2Q21 saw a much lower YoY decline of just 13%, which indicates the firm’s recovery is underway.
Thesis: Strong Balance Sheet and Data Advantage Ensure a Bright Future: Korn Ferry has navigated the challenges of the pandemic with excellent liquidity and ended fiscal 2Q21 with an investable cash balance of $458 million (monthly general and administrative expenses and CAPEX are only ~$21 million). This strong cash balance, along with its ability to generate free cash flow (FCF), helps the firm earn our Attractive Credit Rating.
While having a strong financial position is essential in times of uncertainty, Korn Ferry’s data advantage over its competitors gives us even more optimism about the firm’s future. With over 69 million assessments and awards/benefits data for 20 million people across 12,000 firms, Korn Ferry has one of the largest people and pay databases in the world. The firm leverages this information to better retain clients and generate referral business across its various segments. In fiscal 2020, 90% of the firm’s business was completed on behalf of clients who had worked with Korn Ferry in the previous three years. 71% of revenue was generated from clients that utilized multiple product lines within Korn Ferry’s operations.
Furthermore, the firms strong cash position mentioned above allows it to continue to invest in its data business. Despite short-term setbacks, Korn Ferry should be able to utilize and expand its data advantage and improve its profitability over the long term.
Current Price Leaves Lots of Upside: Below we use our reverse DCF model to analyze the implied value of the stock based on different assumptions about Korn Ferry’s future growth in cash flows.
In this scenario, we assume:
- Korn Ferry’s NOPAT margin returns to fiscal 2020 levels of 10% (vs. 7% TTM)
- Revenue falls less than 1% compounded annually from fiscal 2021 to 2023 (in line with consensus estimates)
- Revenue grows at 3.5% thereafter, which is the average global GDP growth rate since 1961
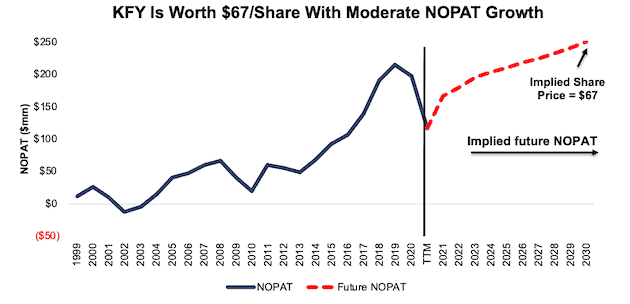
In this scenario, Korn Ferry’s NOPAT grows by just 2% compounded annually over the next decade and the stock is worth $67/share today – a 56% upside to the current price. See the math behind this reverse DCF scenario. For reference, prior to the pandemic, Korn Ferry grew NOPAT by 26% compounded annually since fiscal 2010 and 11% compounded annually since fiscal 2000.
Figure 3: Korn Ferry’s Historical and Implied NOPAT

Sources: New Constructs, LLC and company filings
Lowlight 3: Johnson & Johnson (JNJ) – 2020 Performance: Up 8% vs. S&P 500 up 16%: Since Report Publication on February 26: Up 10% vs. S&P 500 up 21%
In our report, Long Ideas: Finding Gold in the Footnotes, we noted that Johnson & Johnson’s Core Earnings were rising while GAAP net income was falling. Fundamentals are better than most investors realize, and we continue to see upside for this stock.
Reason for Underperformance: The Pandemic Slowed Healthcare Expenditures: The COVID-19 pandemic negatively impacted the healthcare industry as many people deferred elective procedures. As a result of this slow down, Johnson & Johnson’s revenue fell from $82.1 billion in 2019 to $80.9 billion TTM. Furthermore, Johnson & Johnson’s COVID-19 vaccine candidate has taken longer to develop than others from Pfizer (PFE) and Moderna (MRNA) after its trial was temporarily paused in October, which has hurt the stock price as well.
Thesis: Competitive Advantages and Recovery in Healthcare Spending Will Drive Future Revenue: Johnson & Johnson has several advantages that should allow the firm to resume revenue growth in 2021. These include:
- Segment Diversification: The firm operates in the Pharmaceuticals, Medical Devices, and Consumer Health segments.
- Product Diversification: Johnson & Johnson has 26 products generating over $1 billion each in annual sales which further diversifies its revenue stream.
- Market-Leading Products: ~70% of the firm’s sales come from products that have either first or second market share position.
- Large R&D Pipeline: In 2020, Johnson & Johnson had 182 pharmaceutical products in its R&D pipeline making it the fourth largest pipeline worldwide and ahead of other notable firms such as Pfizer, AstraZeneca (AZN), Merck (MRK), GlaxoSmithKline (GSK), and Eli Lilly (ELY).
Furthermore, Johnson & Johnson’s sales should receive a nice boost with a recovery in healthcare expenditures in 2021. After slightly falling in 2020, IHS Markit expects global healthcare expenditures to grow by 5.8% in 2021.
Despite the challenges the firm faced in 2020, Johnson & Johnson continued to grow its economic earnings from $11.4 billion in 2019 $12.2 billion TTM.
With its strong competitive position and improving fundamentals, we believe Johnson & Johnson has plenty of room to grow profits moving forward.
Current Price Leaves Lots of Upside: Below we use our reverse DCF model to analyze the implied value of the stock based on different assumptions about Johnson & Johnson’s future growth in cash flows.
In this scenario, we assume:
- Johnson & Johnson’s NOPAT margin falls to the ten-year low of 22% (vs. 24% in 2019)
- Revenue grows 4% compounded annually from 2020 to 2023 (in line with consensus estimates)
- Revenue grows at 2% thereafter, which is below the average global GDP growth rate since 1961 of 3.5%
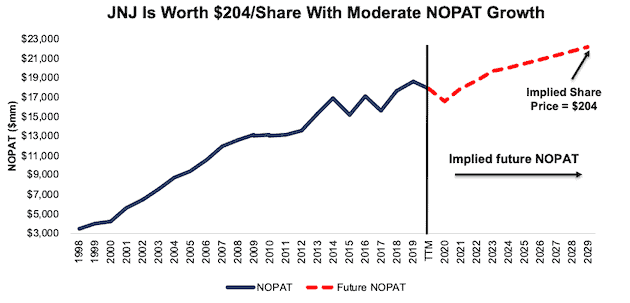
In this scenario, Johnson & Johnson’s NOPAT grows by 2% compounded annually over the next decade and the stock is worth $204/share today – a 29% upside to the current price. See the math behind this reverse DCF scenario. Such a scenario could prove conservative given that Johnson & Johnson has grown NOPAT by 4% compounded annually over the past decade and 8% compounded annually over the past two decades.
Figure 4: Johnson & Johnson’s Historical and Implied NOPAT

Sources: New Constructs, LLC and company filings
This article originally published on January 6, 2021.
Disclosure: David Trainer, Kyle Guske II, and Matt Shuler receive no compensation to write about any specific stock, sector, style, or theme.
Follow us on Twitter, Facebook, LinkedIn, and StockTwits for real-time alerts on all our research.
[1] Our reports utilize our Core Earnings, a superior measure of profits, as demonstrated in Core Earnings: New Data & Evidence, a paper by professors at Harvard Business School (HBS) & MIT Sloan. Recently accepted by the Journal of Financial Economics, the paper proves that our data is superior to all the metrics offered elsewhere.
