Not often can investors get a firm rated #1 in its industry at a discount. This company is one of the most profitable vs. its peers, has multiple growth opportunities, and its stock hasn’t been cheaper since 2013.
Forbes ranked it the “#1 executive recruiting firm” and “#2 professional recruiting firm” in the U.S in 2019. Korn Ferry (KFY: $42/share) is this week’s Long Idea.
Strong Track Record of Growth
Korn Ferry, a global consulting and advisory firm, operates in three key segments. Each segment is growing as firms increasingly rely on recruitment process outsourcing (RPO) and executive turnover reaches record levels.
- Executive Search: help clients attract & retain leaders for positions with average annual cash compensation greater than $360,000.
- Advisory: help clients design the structure, roles, and responsibilities of their organization and help identify the best way to compensate, develop, and motivate employees.
- Recruitment Process Outsourcing (RPO) & Professional Search: help clients find midlevel professionals, ranging from a single search to entire departments or projects.
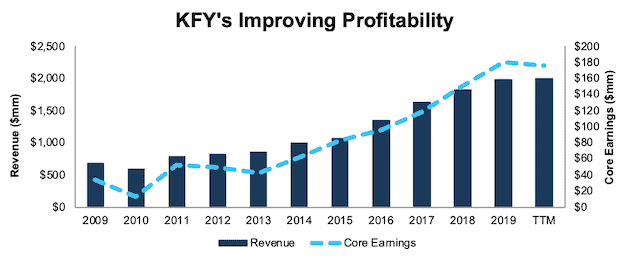
KFY has grown revenue by 11% compounded annually and core earnings by 18% compounded annually over the past decade.
Figure 1: KFY’s Revenue & Core Earnings Since 2009
Sources: New Constructs, LLC and company filings.
Investors only analyzing GAAP numbers get a misleading picture of KFY’s true profitability. In fiscal 2019, GAAP earnings significantly understate KFY’s core earnings due to -$79 million in net earnings distortion[1]. The largest unusual expense in KFY’s filings was a $107 million write-down related to the company’s decision to retire many of its different brand names in an effort to unify under one global brand – Korn Ferry. After removing this non-recurring charge, we see that KFY’s fiscal 2019 core earnings of $180 million are much higher than reported GAAP net income of $102 million.
Quality Corporate Governance Leads to Value Creation
As a consulting/advisory firm involved in helping other client’s determine compensation and pay packages, we would hope to see KFY align its own executives’ pay with ROIC, the performance metric that is directly correlated with creating true shareholder value.
As outlined in the company’s proxy statement, one of the three metrics KFY believes is the most important for shareholders is “the Company’s ability to allocate and deploy capital effectively so that its return on invested capital exceeds the Company’s cost of capital.” Accordingly, KFY includes adjusted ROIC as one of four financial metrics used in determining executives’ annual cash incentives.
Just 15% of executives’ total annual cash incentives were tied to an ROIC target in 2019. We think KFY would benefit by aligning even more compensation to ROIC and foregoing the use of flawed metrics such as adjusted EBITDA margin and adjusted EPS.
Nonetheless, KFY’s emphasis on ROIC is working. Since 2013, KFY’s ROIC has improved from 8% to 13% TTM. Meanwhile, its economic earnings, the true cash flows of the business, improved from just under $1 million to $81 million TTM.
Korn Ferry’s inclusion of ROIC in its executive compensation plan also helps ensure its growth, which includes acquisitions in the past, does not come at the expense of prudent capital stewardship.
KFY’s Profitability Ranks High Amongst Peers
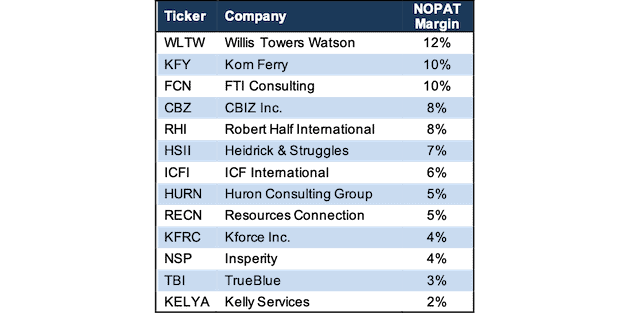
KFY’s profitability ranks at or near the top of its peer group, as defined in the company’s proxy statement. Per Figure 2, KFY earns the second highest net operating profit after-tax (NOPAT) margin among the 12 other publicly traded peers listed in its proxy statement.
Figure 2: KFY’s NOPAT Margin Vs. Peers
Sources: New Constructs, LLC and company filings.
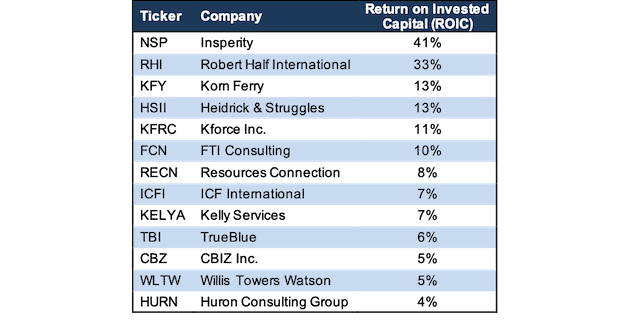
In addition to high NOPAT margins, KFY’s ROIC is improving, while peers’ is falling. KFY’s ROIC has improved from 9% in fiscal 2016 to 13% TTM. Over the same time, the market cap-weighted peer average has fallen from 13% to 12%.
Per Figure 3, KFY’s TTM ROIC currently ranks above the majority of its peers, with the exception of Insperity (NSP) and Robert Half International (RHI). While listed as peers in KFY’s proxy statement, these firms operate in largely different markets. NSP’s business is focused more on payroll processing, benefit plan administration, and HR software for small-to-medium sized businesses and RHI’s business is predominately focused on providing temporary staffing (75% of revenue in 2018). Korn Ferry does very little in either of these markets.
Figure 3: KFY’s ROIC vs. Peers
Sources: New Constructs, LLC and company filings.
These financial results show that KFY’s superior scale and experience (captured in its databases) give it an advantage, as it can leverage a larger network, better information on compensation, and more potential insights on what drives successful recruitment and training.
Leveraging Data Creates Competitive Advantage
To operate across numerous markets, and in any phase of the economic cycle, Korn Ferry created one of the most comprehensive people and pay datasets in the world and, according to the company, “the most widely used job evaluation methodology.” This database includes 4 billion individual data points, 69 million assessments, rewards/benefits data for 20 million people, and organizational benchmark data on 12,000 firms.
Korn Ferry leverages its database and intellectual property across each of its business segments to offer a more comprehensive solution to clients. As Korn Ferry’s CFO stated in its fiscal 2Q20 conference call, when discussing the firm’s RPO capabilities:
“They can bring into the offering successful profiles. They can bring into the offering interview questions, they can bring assessment protocols into their offering. They can bring in pay data into their offering. Other folks can't do that.”
In its Advisory business, KFY further leverages data to achieve a greater scale than what is achievable through traditional face-to-face consulting alone. In the fiscal 2Q20 conference call, KFY’s Senior Vice President – Finance, Treasury, Tax, Investor Relations noted “
“When you look at the trouble with any consulting business is a question of scale. And you -- it's hard to scale people. And what we are doing here is, creating a foundation, where we can scale IP.”
The ability to scale and leverage its database helps increase client retention while creating a more diversified revenue base that is growing through referrals, which helps lower costs and maintain higher margins.
- Client Retention: As noted in KFY’s fiscal 2019 10-K, the company partnered with over 13,800 clients in 2019, including 98% of the Fortune 100. More importantly, 90% of the firm’s business was completed on behalf of clients whom had worked with KFY in the previous three years.
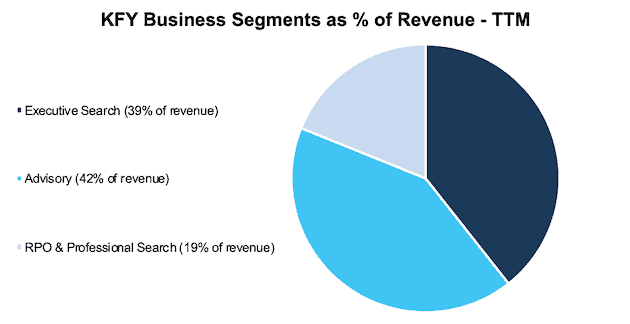
- Diversified Revenue Base Growing Through Referrals: Per Figure 4, over the TTM period, KFY generated 42%, 39%, and 19% of revenue from its Advisory, Executive Search, and RPO & Professional Search segments. Korn Ferry leverages its database to drive meaningful referral business across each segment of its operations.
In fiscal 2019, 15% of revenue in the Advisory segment was referred from its Executive Search and RPO & Profession Search segments. 44% of revenue in the RPO & Professional Search segment was referred from the Executive Search and Advisory segments. Significant levels of referral business not only lower acquisition costs, but also indicates a high level of client satisfaction with Korn Ferry’s products.
Figure 4: Korn Ferry Revenue Breakdown – TTM
Sources: New Constructs, LLC and company filings
Diversification Minimizes Risk During Economic Slowdown
Bears will argue that KFY’s success is a result of a growing economy, and that the poor financial performance of 2008-2010 will recur should the economy enter a recession. However, this argument ignores the diversification of KFY’s business.
During the 2008/2009 recession, KFY faced significant pressure on its fee revenue. Overall revenues fell from $836 million in 2008 to $$600 million in 2010 and NOPAT margins fell from 8% to 3% over the same time. The big difference between then and now? In 2009, in the middle of the recession, KFY’s Executive Search segment accounted for 80% of total revenue. As noted above, over the TTM period, Executive Search accounted for just 39% of total revenue.
Through its Advisory business, the largest source of revenue over the TTM period, KFY more deeply integrates its operations into a client’s organization. Instead of just finding a new CEO, it aids in long-term initiatives such as the development of organizational structure, compensation packages, training and development programs, and even succession planning.
Furthermore, KFY is shifting away from the traditional fee-for-service model and prioritizing subscription based products on its online platform. These subscriptions, which provide clients access to KFY’s database of online tools and assessments, made up 31% of the Advisory segment revenue in fiscal 2019. The expansion of its Advisory segment, and shift to subscription based products creates a stickiness that was previously absent in KFY’s operations.
Expanding RPO Segment Should Alleviate Bears’ Growth Concerns
Bears will also argue that KFY’s impressive growth rates in the past cannot be sustained moving forward. For instance, executive search is largely considered a mature industry, and the global strategic consulting market is expected to grow by 5% compounded annually from 2018-2025.
However, KFY’s biggest growth opportunity comes from its RPO segment, where it designs and implements comprehensive recruitment strategies for its clients. This industry is projected to grow by 29% compounded annually from 2018-2027.
Importantly, KFY’s RPO segment has grown from 15% of revenue in fiscal 2017 to 19% TTM, as noted above. It has achieved high double-digit YoY growth in each of the past two years, as well as the six months ended October 31, 2019. Management also noted in its fiscal 2Q20 earnings call that the firm is out-executing the overall market.
Most importantly, even in a conservative growth scenario, KFY holds significant upside potential, as we’ll show below.
Despite Positives, KFY Remains Undervalued
Numerous case studies show that getting ROIC right is an important part of making smart investments. This paper compares our analytics on a mega cap company to other major providers. The Appendix details exactly how we stack up. The technology that enables this research is featured by Harvard Business School.
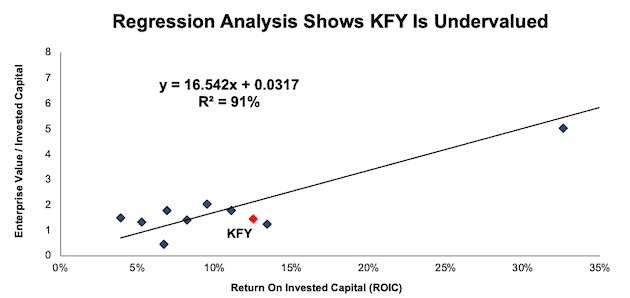
Per Figure 5, ROIC explains 91% of the difference in valuation for the 12 publicly traded peers in KFY’s proxy statement. KFY trades at a discount to peers as shown by its position below the trend line.
Figure 5: ROIC Explains 91% of Difference in Valuation for KFY Peers
Sources: New Constructs, LLC and company filings.
If the stock were to trade at parity with its peers, it would be worth $62/share – 48% above the current stock price. Given its status as the top-ranked, and one of the most profitable companies in the industry, KFY deserves a premium valuation to its peers.
Cheap Valuation Provides Upside
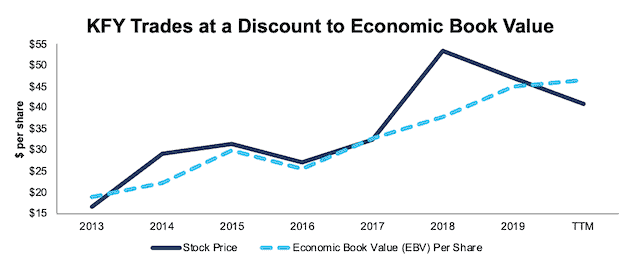
Korn Ferry’s cheap valuation means that the stock still has significant upside potential. At its current price of $42/share, the stock has a price to economic book value (PEBV) ratio of 0.9. This ratio means the market expects KFY’s NOPAT to permanently decline by 10%. This expectation seems rather pessimistic given KFY has grown NOPAT by 18% compounded annually over the past decade and 15% compounded annually over the past two decades.
KFY now trades well below its economic book value, or no-growth value, per Figure 6. KFY hasn’t been this cheap, as measured by its PEBV ratio, since 2013.
Figure 6: KFY’s Stock Price vs. Economic Book Value (EBV)
Sources: New Constructs, LLC and company filings.
Below, we use our reverse DCF model to see what the stock could be worth given conservative assumptions about future growth in cash flows.
If KFY can maintain TTM NOPAT margins of 10% and grow NOPAT by just 5% compounded annually (well below RPO industry growth rate but equal to strategic consulting industry growth rate) over the next decade, the stock is worth $55/share today – a 31% upside to the current stock price. See the math behind this reverse DCF scenario.
Sustainable Competitive Advantages Will Drive Shareholder Value Creation
Here’s a summary of why we think the moat around KFY’s business will enable it to continue to generate higher NOPAT than the current market valuation implies. The following competitive advantages help KFY offer more valuable products/services and prevent competition from taking market share:
- Large database of employee responses, preferences, tendencies, assessments, and more to scale across its business
- Higher margins than majority of peers
- High level of referral business and client retention
What Noise Traders Miss with KFY
These days, fewer investors focus on finding quality capital allocators with shareholder friendly corporate governance. Instead, due to the proliferation of noise traders, the focus is on technical trading trends while high-quality fundamental research is overlooked. Here’s a quick summary of what noise traders are missing:
- Reported profits are understated due to non-recurring write-downs
- ROIC is rising while the peer average is falling
- Expanding into faster growing segments creates future growth opportunities
- Valuation implies permanent decline in profits
Recent Acquisitions Could Spur Additional Growth and Drive Shares Higher
In November 2019, Korn Ferry announced three acquisitions, for $113 million, aimed at developing and building out its new KF Digital segment. These acquisitions bolster KFY’s leadership development, sales training, and project management training programs. The company expects the acquisitions to add $120-130 million in annual fee revenue and generate operating margins ~23-26%, which would rank above each of KFY’s segments in fiscal 2Q20. This new digital segment, which will be split out of KFY’s existing Advisory segment, is more focused on development and learning programs and represents another growth opportunity for KFY.
More importantly, KFY has a history of making smart acquisitions at good prices. In late 2015, KFY acquired Hay Group for $479 million. KFY has since increased its ROIC from 9% in the year of the acquisition to 13% TTM and its economic earnings increased from $37 million to $81 million over the same time. Given the success of this acquisition, along with KFY’s focus on ROIC, we expect more of the same with the acquisitions of Miller Hieman Group, Strategy Execution, and Achieve Forum.
Dividends and Buybacks Offer Over 4% Yield
KFY began paying dividends in 2015 at an annual rate of $0.40/share, where it remains today. The current annualized dividend equates to a dividend yield of 1.0%.
In addition to dividends, KFY returns capital to shareholders through share repurchases. In 2019, KFY repurchased $37 million worth of its shares. Over the TTM, the company repurchased $77 million (3.3% of market cap) worth of shares. As of October 31, 2019, KFY is authorized to repurchase up to $189 million more worth of shares.
If KFY repurchases shares in line with the TTM, we would expect it to repurchase up to 3.3% of the current market cap. Combined with a 1.0% dividend yield and KFY has a total shareholder yield of 4.3%.
KFY is in a strong position to deliver that yield as well. From 2017 to 2019 the company generated $543 million in free cash flow while spending a total of $146 million on dividends and share repurchases.
Insider Trading and Short Interest Are Minimal
Over the past 12 months, insiders have purchased a total of 248 thousand shares and sold 116 thousand shares for a net effect of 132 thousand shares purchased. These purchases represent less than 1% of shares outstanding.
There are currently 1.1 million shares sold short, which equates to less than 2% of shares outstanding and 3 days to cover. Short interest is down 21% over the prior month, which indicates lack of appetite to bet against KFY’s improving fundamentals.
Critical Details Found in Financial Filings by Our Robo-Analyst Technology
As investors focus more on fundamental research, research automation technology is needed to analyze all the critical financial details in financial filings as shown in the Harvard Business School and MIT Sloan paper, "Core Earnings: New Data and Evidence”.
Below are specifics on the adjustments we make based on Robo-Analyst findings in Korn Ferry’s 2019 10-K:
Income Statement: we made $210 million of adjustments with a net effect of removing $103 million in non-operating expenses (5% of revenue). See all adjustments made to KFY’s income statement here.
Balance Sheet: we made $1.4 billion of adjustments to calculate invested capital with a net decrease of $302 million. One of the most notable adjustments was $251 million (14% of reported net assets) in adjustments for operating leases. See all adjustments to KFY’s balance sheet here.
Valuation: we made $1.2 billion of adjustments with a net effect of decreasing shareholder value by $164 million. Apart from $524 million in total debt, the most notable adjustment to shareholder value was $510 million in excess cash. This adjustment represents 22% of KFY’s market cap. See all adjustments to KFY’s valuation here.
Attractive Funds That Hold KFY
The following fund receives our Attractive-or-better rating and allocates significantly to Korn Ferry.
- The Acquirers Fund (ZIG) – 3.4% allocation and Very Attractive rating.
This article originally published on February 5, 2020.
Disclosure: David Trainer, Kyle Guske II, and Matt Shuler receive no compensation to write about any specific stock, style, or theme.
Follow us on Twitter, Facebook, LinkedIn, and StockTwits for real-time alerts on all our research.
[1] In Core Earnings: New Data & Evidence, professors at Harvard Business School (HBS) & MIT Sloan empirically show that our “novel dataset” is superior to “Street Earnings” from Refinitiv’s IBES, owned by Blackstone (BX) and Thomson Reuters (TRI), and “Income Before Special Items” from Compustat, owned by S&P Global (SPGI).
