
Check out this week’s Danger Zone interview with Chuck Jaffe of Money Life.
The earnings recession is worse than it looks on the surface. While GAAP earnings are down 1% over the trailing twelve months (TTM), core earnings are down 6%. The difference is Earnings Distortion, which just hit levels not seen since the last two market crashes. We recently showed that there are sectors that are more profitable than they appear. On the flip side, there are also sectors that are less profitable than they appear because earnings distortion is much higher and earnings are more overstated.
The Technology sector’s earnings distortion worsened more than any other sector over the trailing twelve months and now ranks as second worst behind REITs. Reported earnings have not been this overstated, relative to core earnings, for the Tech sector since the Tech bubble. The Technology sector is in the Danger Zone.
Earnings Distortion Rankings by Sector
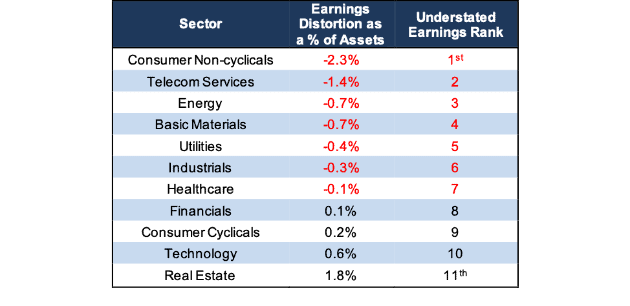
Figure 1 ranks all 11 sectors by earnings distortion as a percentage of total assets[1] – which professors from HBS and MIT Sloan used in a long/short strategy that generated 10% in abnormal returns. Four of the eleven sectors have positive earnings distortion, i.e. overstated earnings, as do the top three sectors in terms of total assets – Technology, Consumer Cyclicals, and Financials.
Figure 1: Earnings Distortion as of December 3, 2019
Sources: New Constructs, LLC and company filings
Misleading Earnings in the Technology Sector
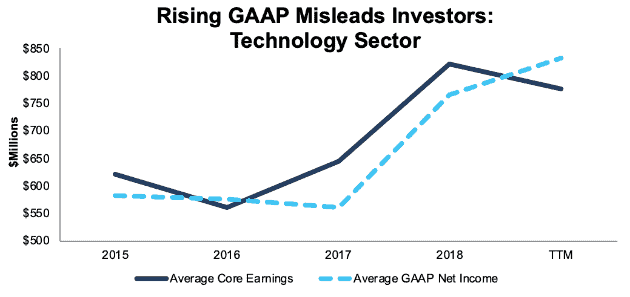
Investors who only look at GAAP earnings would think the Technology sector is still growing profits. Average GAAP earnings for the 425 companies we cover in the sector improved from $561 million in 2017 to $766 million in 2018, a 37% increase. GAAP earnings increased another 9%, to $833 million, between 2018 and the trailing twelve months (TTM) period. On the other hand, average core earnings were up 27% between 2017 and 2018 and actually fell 6% from 2018 to TTM.
Figure 2: Technology Sector Average Core Earnings vs. GAAP: 2015-TTM
Sources: New Constructs, LLC and company filings.
Earnings Distortion Reaches Tech Bubble Highs
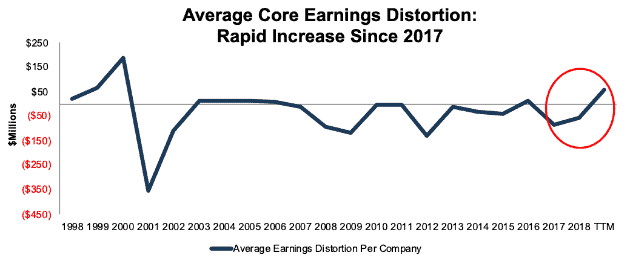
Figure 3 shows earnings distortion from hidden gains is on a rapid rise and has not been this high since the tech bubble in 2000.
The rapid rise in earnings distortion since 2017 means that an increasing amount of technology firms’ income is coming from unusual or one-time gains, which is not apparent to investors analyzing press releases or income statements. Corporate managers hide (as shown in this HBS & MIT Sloan paper) the one-time nature of these gains by only disclosing them in the fine print. In other words, managers are dressing up the numbers in an increasingly aggressive manner over the last few years.
Figure 3: Average Core Earnings Distortion: Technology Sector Since 1998
Sources: New Constructs, LLC and company filings.
Tech Giants Drive the Rise and Fall of Core Earnings
Our prior report shows Apple (AAPL), Facebook (FB), Alphabet (GOOGL), and Microsoft (MSFT) have delivered the vast majority of profit growth in the Technology sector in the past. Consequently, when profits for those firms weaken, the entire sector looks bad.
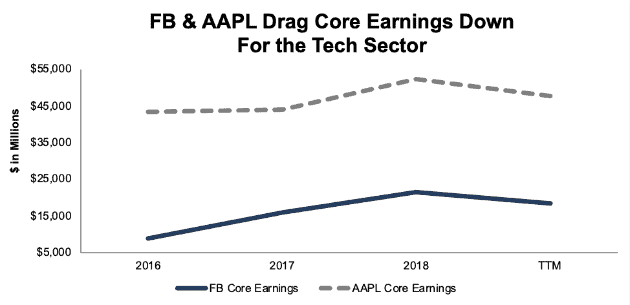
Over the TTM, Facebook and Apple’s core earnings took a dive and fell a combined $7.4 billion while Alphabet and Microsoft managed a combined increase of just $4.9 billion. Note that Netflix (NFLX), also a FAANG stock, has never been a significant contributor of core earnings despite having the sector’s 14th highest market cap[2].
Core earnings across the entire Technology sector fell $19.5 billion from 2018-TTM. So, two firms, out of 425, accounted for 38% of the decline in the Technology sector’s core earnings from 2018-TTM. No other firms have nearly as large an impact on the overall sector’s core earnings[3] decline.
Figure 4 shows the decline in Apple and Facebook’s core earnings is a stark departure from prior years gains.
Figure 4: Core Earnings: Apple & Facebook: 2016-TTM
Sources: New Constructs, LLC and company filings.
ROIC Is Declining for the Tech Sector
Return on invested capital (ROIC) for AAPL and FB, along with other big Technology firms, is declining. We see declines in both NOPAT margins and invested capital turns – the two drivers of ROIC.
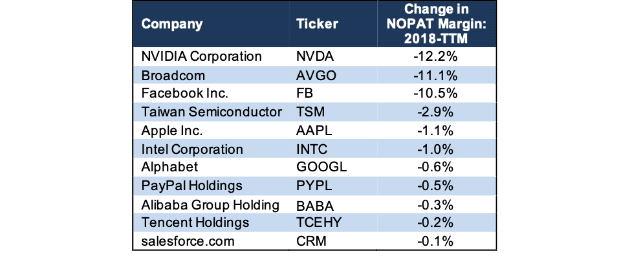
Figure 5 shows the 11 firms, out of the top 20 Technology firms by market cap, with declining NOPAT margins from 2018-TTM. Facebook, NVIDIA (NVDA), and Broadcom (AVGO) stand out for the magnitude of decline in their respective NOPAT margin.
Figure 5: Top Tech Firms’ Declining Profitability
Sources: New Constructs, LLC and company filings.
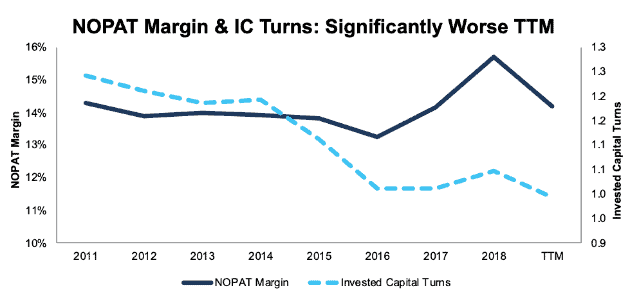
Figure 6 shows NOPAT margins for the entire Technology sector have fallen significantly over the TTM period: down from 15.7% in 2018 to 14.2% TTM. NOPAT margins are now lower than the 14.3% achieved in 2011, the year after margins spiked up after the financial crisis ended.
Aggregate invested capital turns, which measure the capital efficiency of a business, in the Technology sector are down from 1.05 in 2018 to 0.99 TTM. Longer-term, invested capital turns are down from 1.24 in 2011 to 0.99 TTM. This decline shows the Technology sector is generating less revenue per dollar of invested capital. See the Appendix for analysis of NOPAT margin and invested capital turns back to 1998.
Figure 6: Technology Sector Margins and Capital Turns: 2011-TTM
Sources: New Constructs, LLC and company filings.
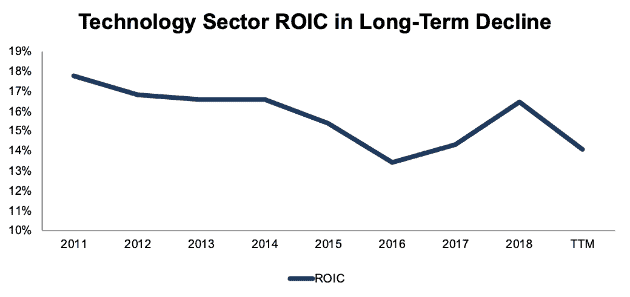
Per Figure 7, the Technology sector’s ROIC has fallen from 18% in 2011 to 14% TTM. See the Appendix for analysis of ROIC back to 1998.
Figure 7: Technology Sector ROIC: 2011-TTM
Sources: New Constructs, LLC and company filings.
Notably, the three largest Technology firms by market cap have all seen their ROICs decline significantly over this timeframe, per Figure 8.
Apple’s ROIC declined from 336% in 2011 to 98% TTM. Microsoft’s ROIC declined from 75% in 2011 to 36% TTM. Alphabet’s ROIC declined from 45% in 2011 to 32% TTM. More recently, Apple’s ROIC declined from 129% in 2018 to 98% TTM while Facebook’s ROIC declined from 42% to 31% over the same time.
Figure 8: Big Tech Firms’ Declining ROIC from 2011-TTM

Sources: New Constructs, LLC and company filings.
Earnings Distortion Research Reveals a Stock to Avoid
Microchip Technology (MCHP: $99/share) has rising earnings distortion and earns our Very Unattractive rating. MCHP’s earnings distortion increased from -$523 million in fiscal 2018 to $74 million TTM.
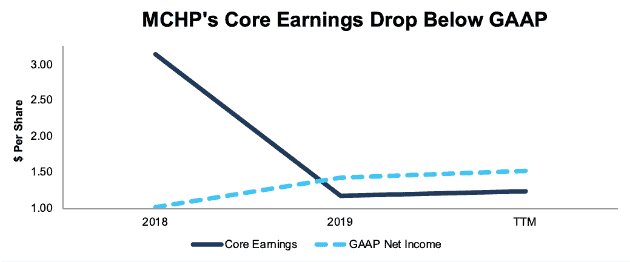
Last year, fiscal 2018 earnings were understated in large part due to a one-time $654 million charge due to tax reform. After removal of this, and other, non-recurring charges, we see that MCHP’s fiscal 2018 core earnings per share were over three times as high as reported GAAP net income per share.
In fiscal 2019, core earnings per share were 17% lower than GAAP net income per share. Over the TTM period, core earnings per share are 19% lower than GAAP net income per share. See Figure 9.
Figure 9: MCHP’s Core Earnings Vs. GAAP Net Income Per Share: Fiscal 2018-TTM
Sources: New Constructs, LLC and company filings
Contributing to the positive earnings distortion in the TTM period are non-recurring items such as $3 million in other income, which is primarily attributable to foreign currency fluctuations, in fiscal 1Q20.
In total, MCHPs GAAP earnings per share increased 49% from fiscal 2018-TTM. Meanwhile, core earnings per share 61% over the same time.
Weak Internal Control Warning: In addition to overstated earnings in the TTM period, another red flag lingers over MCHP. MCHP’s auditor, Ernst & Young, noted in the firm’s fiscal 2019 10-K that “Microchip Technology Incorporated (the Company) has not maintained effective internal control over financial reporting.” This opinion was given due to the fact that management “identified a material weakness in the operating effectiveness of controls related to the Company’s income tax process. Management also identified a material weakness in the design effectiveness of certain IT general controls relating to system access.”
Such an opinion raises the risk of investing in MCHP, as there is a “reasonable possibility that a material misstatement of the company’s annual or interim financial statements will not be prevented or detected on a timely basis.” We provide more details on weak internal controls here.
Overvalued Stock: With a P/E ratio of 65, it’s clear, even by traditional metrics, that MCHP is overvalued. The Technology sector has an average P/E ratio of 30 and the S&P 500 average sits at 23.
We use our reverse discounted cash flow (DCF) model to more rigorously assesses the valuation of this stock by quantifying the expectations for future profit growth baked into the stock price.
In order to justify its price of $99/share, MCHP must achieve a 17% NOPAT margin (average of last five years, compared to 15% in fiscal 2019) and grow NOPAT by 11% compounded annually for the next 15 years. This expectation looks rather ambitious when one considers that MCHP’s NOPAT fell 17% year-over-year in fiscal 2019 and TTM NOPAT is up just 5% over the prior TTM period. See the math behind this reverse DCF scenario.
Even if MCHP achieves a 24% NOPAT margin (as it did in fiscal 2018, before plummeting to 15% the following year) and grows NOPAT by 10% compounded annually over the next decade, the stock is worth $56/share today, a 43% downside to the current stock price. See the math behind this reverse DCF scenario.
Analyzing Earnings Distortion Across the Rest of the Market
Figures 10-31 show average core earnings vs. GAAP and average core earnings distortion for all 11 sectors.
Basic Materials
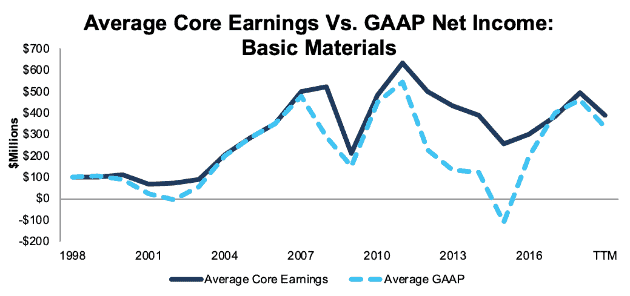
Figure 10 shows average core earnings grew by 24% compounded annually from 2015 to 2018, driven by rising commodity prices. From 2018 to TTM, core earnings declined by 21%
Figure 10: Basic Materials Average Core Earnings vs. GAAP: 1998-TTM
Sources: New Constructs, LLC and company filings
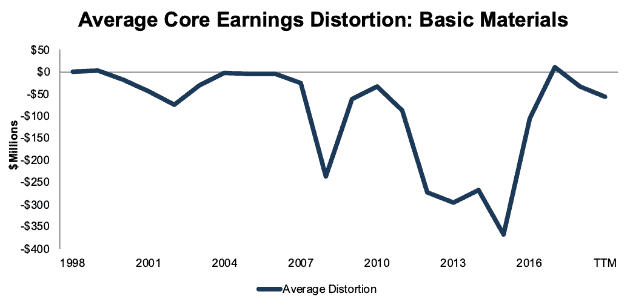
Figure 11 shows earnings distortion for the sector has remained relatively low for most of the past 20 years. The only exception is from 2012-2015 when volatility in commodity prices drove significant write-downs. TTM GAAP earnings understate core earnings by an average of $56 million, or 14%, for the 146 companies in the sector we currently cover.
Figure 11: Basic Materials Average Core Earnings Distortion: 1998-TTM
Sources: New Constructs, LLC and company filings
Consumer Cyclicals
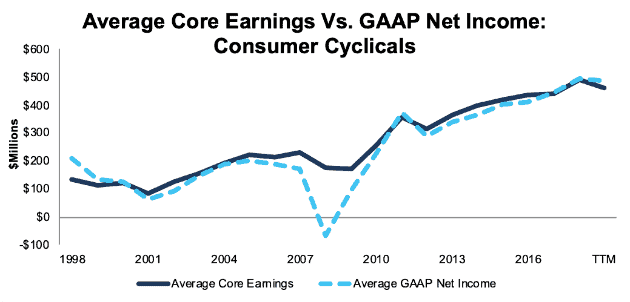
TTM core earnings are down for the Consumer Cyclicals sector after six consecutive years of growth from 2012-2018. Average core earnings declined 6% from 2018 to TTM, while GAAP net income is down just 2%.
Figure 12: Consumer Cyclicals Average Core Earnings vs. GAAP: 1998-TTM
Sources: New Constructs, LLC and company filings
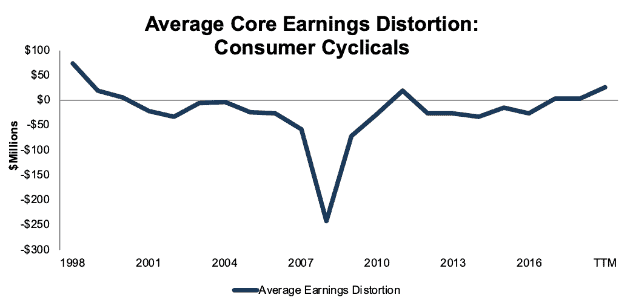
At $24 million over the TTM, the average earnings distortion is the highest in the sector since 1998. Non-recurring gains are masking some of the real challenges Consumer Cyclicals firms face.
Figure 13: Consumer Cyclicals Average Core Earnings Distortion: 1998-TTM
Sources: New Constructs, LLC and company filings
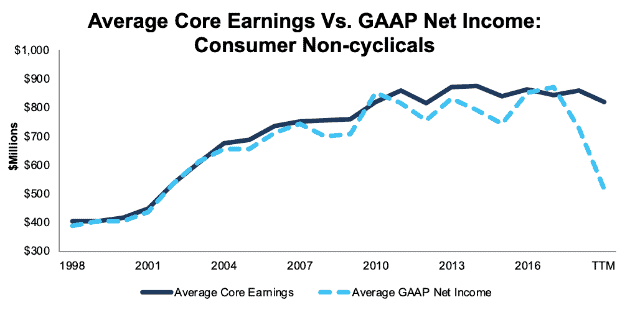
Consumer Non-cyclicals
Average GAAP earnings for the 128 companies we covered in the sector fell from $870 million per company in 2017 to $729 million per company in 2018, a 16% decline. Average GAAP earnings per company declined another 29%, down to $516 million, between 2018 and the trailing twelve months (TTM) period. On the other hand, average core earnings were up 2% between 2017 and 2018, and down just 5% from 2018 to TTM.
Figure 14: Consumer Non-cyclicals Average Core Earnings vs. GAAP: 1998-TTM
Sources: New Constructs, LLC and company filings
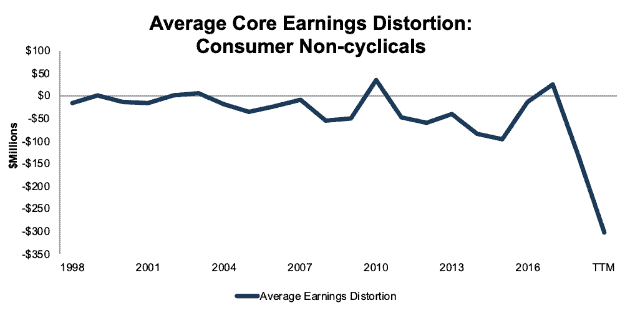
From 1998-2007, average earnings distortion in the Consumer Non-cyclicals sector stayed near zero, while over the past decade the difference between GAAP net income and core earnings has increased significantly.
Figure 15: Consumer Non-cyclicals Average Core Earnings Distortion: 1998-TTM
Sources: New Constructs, LLC and company filings
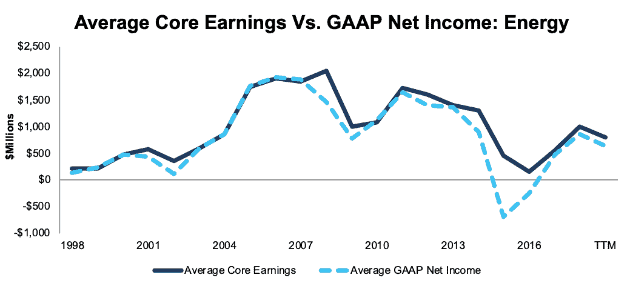
Energy
Similar to the Basic Materials sector, core earnings in the Energy sector rebounded from 2016-2018 due to rising commodity prices, but declined by 21% from 2018-TTM.
Figure 16: Energy Average Core Earnings vs. GAAP: 1998-TTM
Sources: New Constructs, LLC and company filings
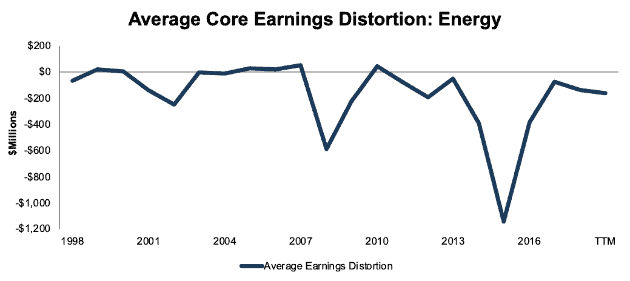
Aside from a couple of big troughs during commodity crashes in 2008 and 2015, GAAP earnings have been relatively accurate (minimal earnings distortion) in the Energy sector. The TTM trend in GAAP net income (down 27% since 2018) looks slightly worse than core earnings (down 21% since 2018).
Figure 17: Energy Average Core Earnings Distortion: 1998-TTM
Sources: New Constructs, LLC and company filings
Financials
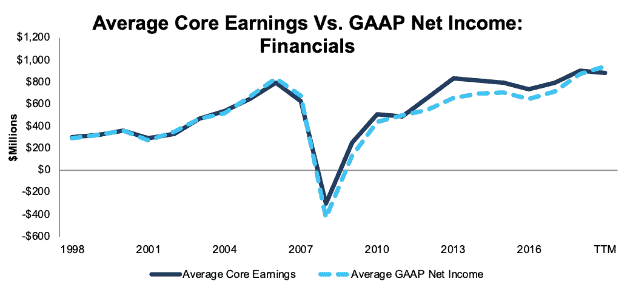
Average core earnings are down 2% in the Financials sector from 2018-TTM, while GAAP earnings are up 8%. Investors who rely on GAAP likely think profits are better than they really are.
Figure 18: Financials Average Core Earnings vs. GAAP: 1998-TTM
Sources: New Constructs, LLC and company filings
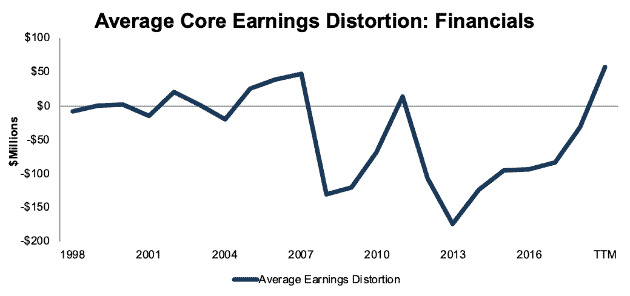
One reason for the spike in earnings distortion over the TTM period is the recent adoption of the accounting standard ASU 2016-01. The rule, which went into effect in 2018, requires unrealized gains and losses on securities to be recognized directly on the income statement, rather than waiting until the securities are sold. Due to this rule, Berkshire Hathaway (BRK.A) has nearly $40 billion in unrealized investment gains artificially increasing its net income through the first nine months of 2019.
Figure 19: Financials Average Core Earnings Distortion: 1998-TTM
Sources: New Constructs, LLC and company filings
Healthcare
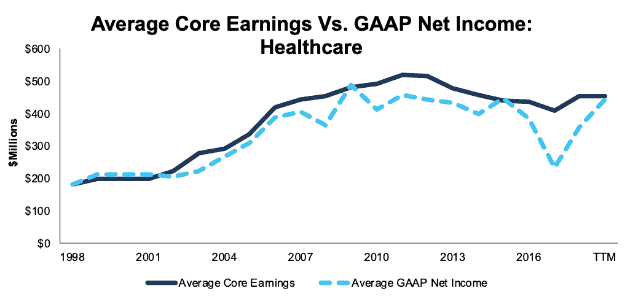
TTM core earnings and GAAP net income are nearly identical in the Healthcare sector, but the trend in these two metrics is very different. Average core earnings are flat from 2018-TTM, while average GAAP earnings are up 24%.
Figure 20: Healthcare Average Core Earnings vs. GAAP: 1998-TTM
Sources: New Constructs, LLC and company filings
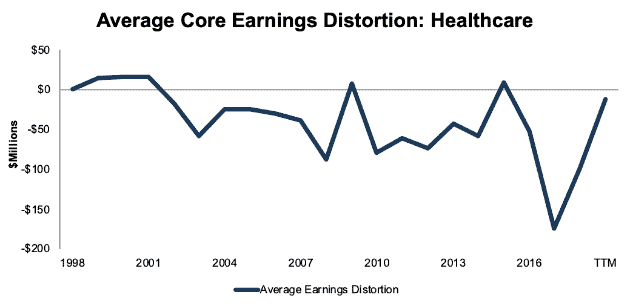
Earnings distortion was highly negative for the sector in 2017-2018, due in part to the impact of tax reform. Johnson and Johnson (JNJ), for example, had a $10 billion non-recurring tax charge in 2017 and a $1.6 billion charge in 2018. Now that these unusual charges from tax reform are nearly done, earnings distortion is back close to 0.
Figure 21: Healthcare Average Core Earnings Distortion: 1998-TTM
Sources: New Constructs, LLC and company filings
Industrials
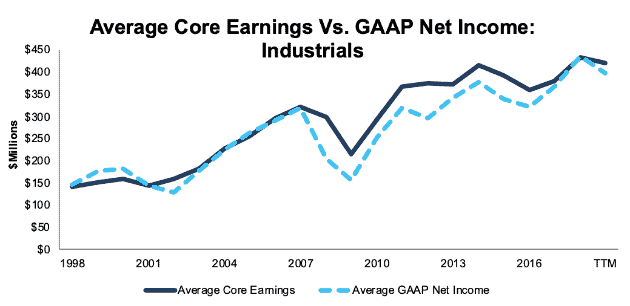
GAAP net income overstates the magnitude of the decline for companies in the Industrials sector. Average GAAP earnings are down 9% from 2018-TTM, while core earnings are down just 3%.
Figure 22: Industrials Average Core Earnings vs. GAAP: 1998-TTM
Sources: New Constructs, LLC and company filings
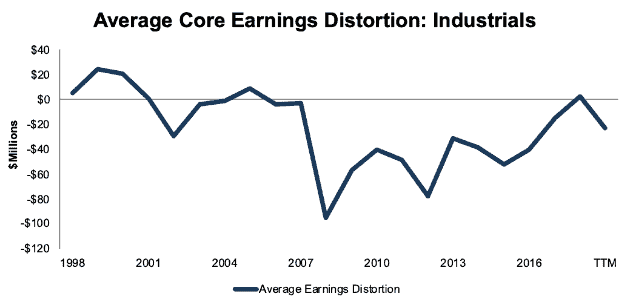
While earnings for the sector as a whole are understated, there are still companies with overstated earnings that investors should avoid. We recently highlighted Northrop Grumman (NOC) as a stock investors should avoid due to its overstated earnings from non-operating pension gains.
Figure 23: Industrials Average Core Earnings Distortion: 1998-TTM
Sources: New Constructs, LLC and company filings
Real Estate
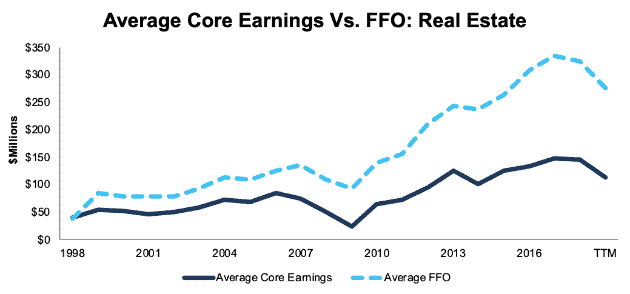
Average core earnings declined by 23% between 2018-TTM for the Real Estate sector, while funds from operations (FFO) – the preferred metric used by REIT investors – declined by 15%.
Figure 24: Real Estate Average Core Earnings vs. FFO: 1998-TTM
Sources: New Constructs, LLC and company filings
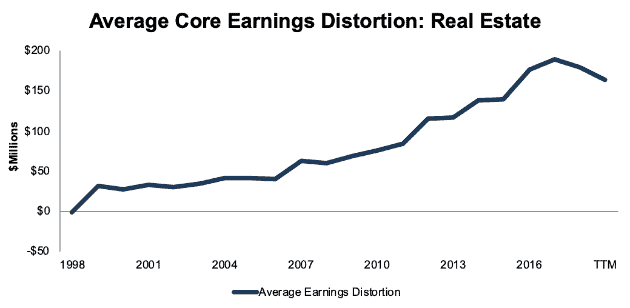
Earnings distortion in the Real Estate sector steadily increased from 1998-2017. The level of earnings distortion declined slightly in 2018 and TTM, but earnings distortion remains higher in the Real Estate sector than in any other sector of the market.
Figure 25: Real Estate Average Core Earnings Distortion: 1998-TTM
Sources: New Constructs, LLC and company filings
Technology
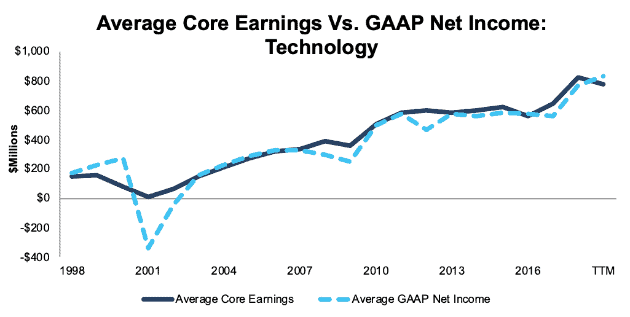
Core earnings and GAAP net income tell completely different stories over the TTM period of the Technology sector. Average core earnings declined 6%, while GAAP earnings are up 9%. The 40% gain for the Technology Select Sector SPDR Fund (XLK) in 2019 suggests that, right now, misleading GAAP earnings may be fooling investors.
Figure 26: Technology Average Core Earnings vs. GAAP: 1998-TTM
Sources: New Constructs, LLC and company filings
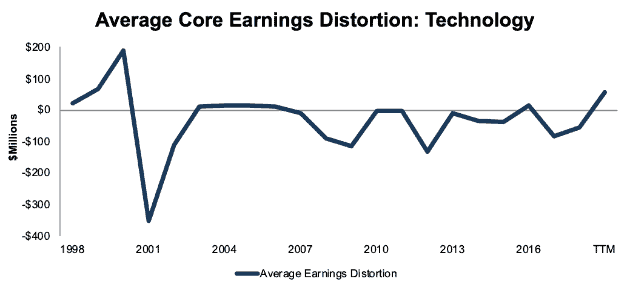
Figure 27 shows average earnings distortion in the tech sector is at its highest point since 2000, the peak of the tech bubble. Technology investors could be in for a rude awakening when managers run out of earnings distortion tricks and GAAP net income follows core earnings down.
Figure 27: Technology Average Core Earnings Distortion: 1998-TTM
Sources: New Constructs, LLC and company filings
Telecom
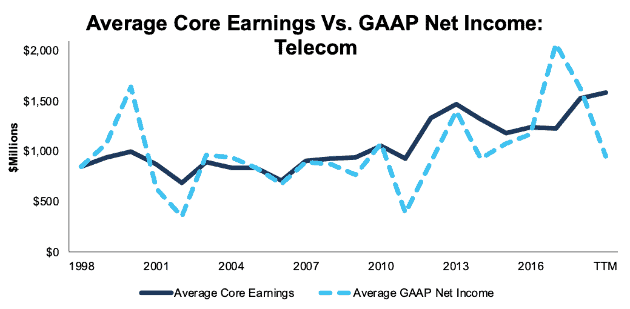
Average core earnings are up 4% between 2018-TTM for the Telecom sector. As we noted previously, the Telecom sector is the only sector with a rising ROIC.
Figure 28: Telecom Average Core Earnings vs. GAAP: 1998-TTM
Sources: New Constructs, LLC and company filings
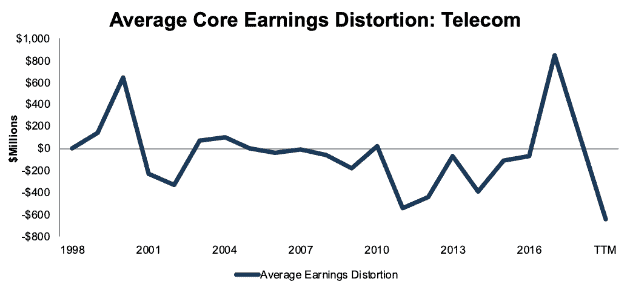
Despite the solid core earnings growth in the sector, average TTM GAAP earnings are down sharply, which leads to significant value opportunities for diligent investors. We recently made Verizon (VZ) a Long Idea due in part to its understated earnings from non-recurring restructuring and write-down charges.
Figure 29: Telecom Average Core Earnings Distortion: 1998-TTM
Sources: New Constructs, LLC and company filings
Utilities
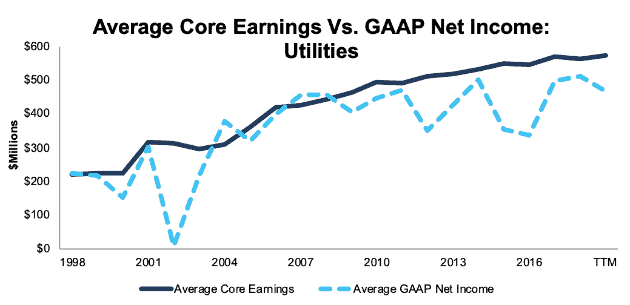
Utilities also have rising core earnings and declining GAAP net income. Average core earnings are up 2% from 2018-TTM, while average GAAP earnings declined by 8%. Despite the core earnings growth, we still have an Unattractive rating on the sector due to its low ROIC and negative free cash flow.
Figure 30: Utilities Average Core Earnings vs. GAAP: 1998-TTM
Sources: New Constructs, LLC and company filings
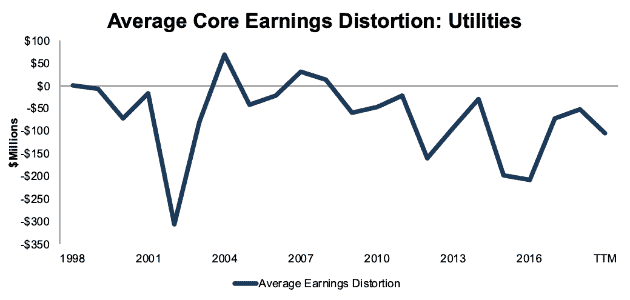
Historically, Utilities have rarely had overstated earnings. 1998, 2004, 2007, and 2008 are the only years out of the last 20 when the sector has had positive earnings distortion.
Figure 31: Utilities Average Core Earnings Distortion: 1998-TTM
Sources: New Constructs, LLC and company filings.
This article originally published on December 10, 2019.
Disclosure: David Trainer, Kyle Guske II, and Sam McBride receive no compensation to write about any specific stock, style, or theme.
Follow us on Twitter, Facebook, LinkedIn, and StockTwits for real-time alerts on all our research.
Appendix I: ROIC, NOPAT Margin and Invested Capital Turns Since 1998
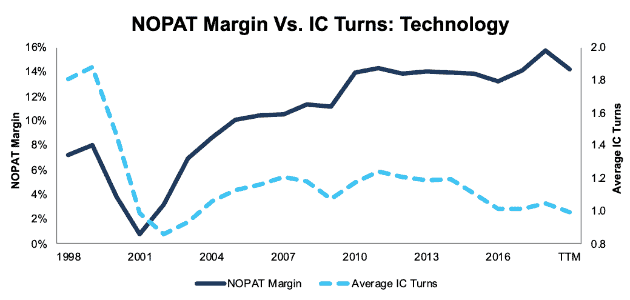
This appendix shows the two drivers of ROIC – NOPAT margin and invested capital turns – as well as ROIC for the Technology sector going back to 1998. For more information on how we calculate these drivers of ROIC, see here. For more information on how we calculate ROIC, see here.
Figure 32: Technology Sector NOPAT Margin and IC Turns: 1998 to present
Sources: New Constructs, LLC and company filings.
Figure 33: Technology Sector ROIC: 1998 to present
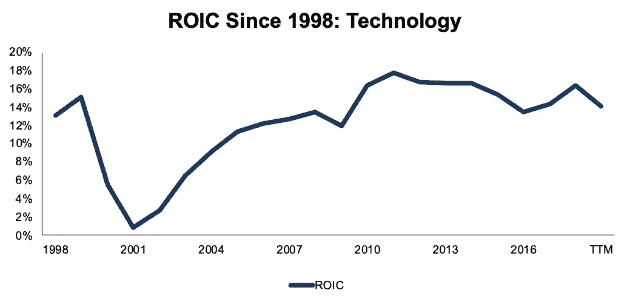
Sources: New Constructs, LLC and company filings.
[1] Data in Figure 1 comes from the 2,764 companies for which we have TTM data. Number of companies by sector: Consumer Non-cyclicals – 127, Energy – 172, Telecom – 37, Industrials – 410, Basic Materials – 146, Utilities – 67, Healthcare – 339, Real Estate – 187, Consumer Cyclicals – 432, Financials – 422, Technology – 425.
[2] Here’s our latest report on the disconnect between Netflix's fundamentals and valuation.
[3] More details on core earnings by company available here.